Maltese vs Chilean 12th Grade, No Diploma
COMPARE
Maltese
Chilean
12th Grade, No Diploma
12th Grade, No Diploma Comparison
Maltese
Chileans
93.3%
12TH GRADE, NO DIPLOMA
100.0/ 100
METRIC RATING
16th/ 347
METRIC RANK
91.7%
12TH GRADE, NO DIPLOMA
85.8/ 100
METRIC RATING
136th/ 347
METRIC RANK
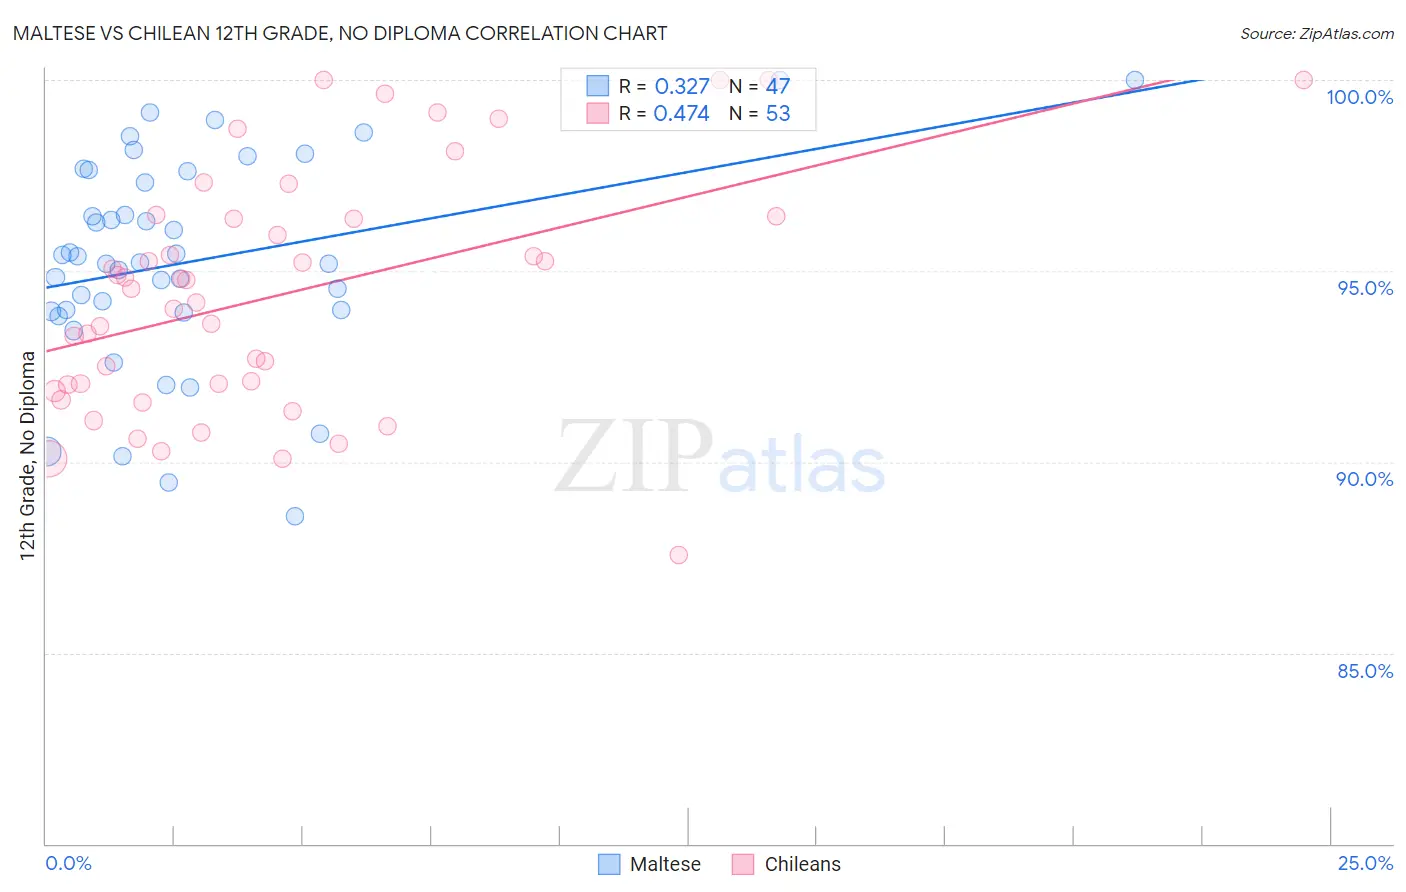
Maltese vs Chilean 12th Grade, No Diploma Correlation Chart
The statistical analysis conducted on geographies consisting of 126,478,003 people shows a mild positive correlation between the proportion of Maltese and percentage of population with at least 12th grade (no diploma) education in the United States with a correlation coefficient (R) of 0.327 and weighted average of 93.3%. Similarly, the statistical analysis conducted on geographies consisting of 256,681,007 people shows a moderate positive correlation between the proportion of Chileans and percentage of population with at least 12th grade (no diploma) education in the United States with a correlation coefficient (R) of 0.474 and weighted average of 91.7%, a difference of 1.8%.
12th Grade, No Diploma Correlation Summary
| Measurement | Maltese | Chilean |
| Minimum | 88.6% | 87.6% |
| Maximum | 100.0% | 100.0% |
| Range | 11.4% | 12.4% |
| Mean | 95.2% | 94.4% |
| Median | 95.2% | 94.5% |
| Interquartile 25% (IQ1) | 93.9% | 91.9% |
| Interquartile 75% (IQ3) | 97.6% | 96.4% |
| Interquartile Range (IQR) | 3.7% | 4.5% |
| Standard Deviation (Sample) | 2.7% | 3.1% |
| Standard Deviation (Population) | 2.7% | 3.1% |
Similar Demographics by 12th Grade, No Diploma
Demographics Similar to Maltese by 12th Grade, No Diploma
In terms of 12th grade, no diploma, the demographic groups most similar to Maltese are Luxembourger (93.3%, a difference of 0.020%), Finnish (93.4%, a difference of 0.040%), Immigrants from Singapore (93.3%, a difference of 0.050%), German (93.3%, a difference of 0.070%), and Filipino (93.2%, a difference of 0.10%).
| Demographics | Rating | Rank | 12th Grade, No Diploma |
| Latvians | 100.0 /100 | #9 | Exceptional 93.6% |
| Croatians | 100.0 /100 | #10 | Exceptional 93.5% |
| Poles | 100.0 /100 | #11 | Exceptional 93.5% |
| Eastern Europeans | 100.0 /100 | #12 | Exceptional 93.5% |
| Danes | 100.0 /100 | #13 | Exceptional 93.5% |
| Bulgarians | 100.0 /100 | #14 | Exceptional 93.5% |
| Finns | 100.0 /100 | #15 | Exceptional 93.4% |
| Maltese | 100.0 /100 | #16 | Exceptional 93.3% |
| Luxembourgers | 100.0 /100 | #17 | Exceptional 93.3% |
| Immigrants | Singapore | 99.9 /100 | #18 | Exceptional 93.3% |
| Germans | 99.9 /100 | #19 | Exceptional 93.3% |
| Filipinos | 99.9 /100 | #20 | Exceptional 93.2% |
| Italians | 99.9 /100 | #21 | Exceptional 93.2% |
| Estonians | 99.9 /100 | #22 | Exceptional 93.2% |
| Scandinavians | 99.9 /100 | #23 | Exceptional 93.2% |
Demographics Similar to Chileans by 12th Grade, No Diploma
In terms of 12th grade, no diploma, the demographic groups most similar to Chileans are Alaska Native (91.6%, a difference of 0.020%), Immigrants from Bosnia and Herzegovina (91.7%, a difference of 0.040%), Arab (91.6%, a difference of 0.040%), Immigrants from Egypt (91.6%, a difference of 0.050%), and Venezuelan (91.7%, a difference of 0.060%).
| Demographics | Rating | Rank | 12th Grade, No Diploma |
| German Russians | 89.8 /100 | #129 | Excellent 91.8% |
| Assyrians/Chaldeans/Syriacs | 89.6 /100 | #130 | Excellent 91.8% |
| Albanians | 89.3 /100 | #131 | Excellent 91.8% |
| Immigrants | Eastern Asia | 89.3 /100 | #132 | Excellent 91.8% |
| Immigrants | Italy | 88.3 /100 | #133 | Excellent 91.7% |
| Venezuelans | 88.2 /100 | #134 | Excellent 91.7% |
| Immigrants | Bosnia and Herzegovina | 87.3 /100 | #135 | Excellent 91.7% |
| Chileans | 85.8 /100 | #136 | Excellent 91.7% |
| Alaska Natives | 84.9 /100 | #137 | Excellent 91.6% |
| Arabs | 84.1 /100 | #138 | Excellent 91.6% |
| Immigrants | Egypt | 83.9 /100 | #139 | Excellent 91.6% |
| Immigrants | Poland | 82.3 /100 | #140 | Excellent 91.6% |
| Argentineans | 82.0 /100 | #141 | Excellent 91.6% |
| Immigrants | Venezuela | 80.9 /100 | #142 | Excellent 91.6% |
| Immigrants | Argentina | 80.7 /100 | #143 | Excellent 91.6% |