Sierra Leonean vs Immigrants from West Indies Professional Degree
COMPARE
Sierra Leonean
Immigrants from West Indies
Professional Degree
Professional Degree Comparison
Sierra Leoneans
Immigrants from West Indies
4.5%
PROFESSIONAL DEGREE
64.3/ 100
METRIC RATING
163rd/ 347
METRIC RANK
4.0%
PROFESSIONAL DEGREE
5.6/ 100
METRIC RATING
228th/ 347
METRIC RANK
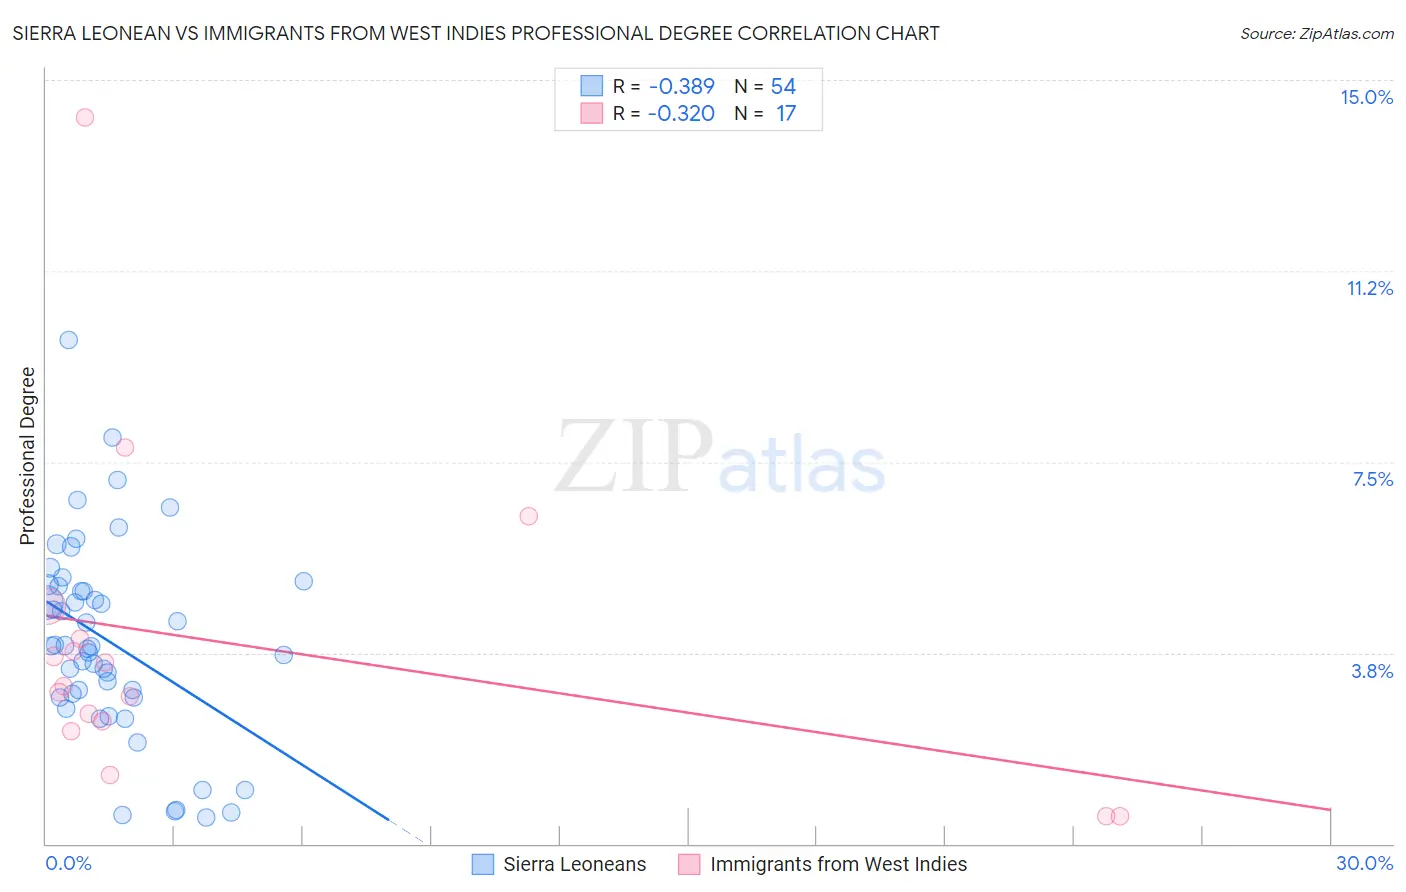
Sierra Leonean vs Immigrants from West Indies Professional Degree Correlation Chart
The statistical analysis conducted on geographies consisting of 83,321,250 people shows a mild negative correlation between the proportion of Sierra Leoneans and percentage of population with at least professional degree education in the United States with a correlation coefficient (R) of -0.389 and weighted average of 4.5%. Similarly, the statistical analysis conducted on geographies consisting of 72,432,787 people shows a mild negative correlation between the proportion of Immigrants from West Indies and percentage of population with at least professional degree education in the United States with a correlation coefficient (R) of -0.320 and weighted average of 4.0%, a difference of 13.8%.
Professional Degree Correlation Summary
| Measurement | Sierra Leonean | Immigrants from West Indies |
| Minimum | 0.52% | 0.54% |
| Maximum | 9.9% | 14.3% |
| Range | 9.4% | 13.7% |
| Mean | 4.0% | 3.9% |
| Median | 3.9% | 3.1% |
| Interquartile 25% (IQ1) | 2.9% | 2.3% |
| Interquartile 75% (IQ3) | 5.1% | 4.3% |
| Interquartile Range (IQR) | 2.2% | 2.0% |
| Standard Deviation (Sample) | 1.9% | 3.2% |
| Standard Deviation (Population) | 1.9% | 3.1% |
Similar Demographics by Professional Degree
Demographics Similar to Sierra Leoneans by Professional Degree
In terms of professional degree, the demographic groups most similar to Sierra Leoneans are Peruvian (4.5%, a difference of 0.14%), Assyrian/Chaldean/Syriac (4.5%, a difference of 0.48%), Swiss (4.5%, a difference of 0.50%), Immigrants from Senegal (4.5%, a difference of 0.59%), and Vietnamese (4.5%, a difference of 0.64%).
| Demographics | Rating | Rank | Professional Degree |
| Swedes | 69.9 /100 | #156 | Good 4.5% |
| Iraqis | 69.8 /100 | #157 | Good 4.5% |
| Immigrants | Armenia | 68.8 /100 | #158 | Good 4.5% |
| Vietnamese | 68.4 /100 | #159 | Good 4.5% |
| Immigrants | Senegal | 68.0 /100 | #160 | Good 4.5% |
| Assyrians/Chaldeans/Syriacs | 67.4 /100 | #161 | Good 4.5% |
| Peruvians | 65.2 /100 | #162 | Good 4.5% |
| Sierra Leoneans | 64.3 /100 | #163 | Good 4.5% |
| Swiss | 61.0 /100 | #164 | Good 4.5% |
| Costa Ricans | 59.9 /100 | #165 | Average 4.5% |
| Immigrants | Colombia | 59.4 /100 | #166 | Average 4.5% |
| Immigrants | Afghanistan | 59.2 /100 | #167 | Average 4.5% |
| Immigrants | Sierra Leone | 58.7 /100 | #168 | Average 4.5% |
| Chinese | 58.6 /100 | #169 | Average 4.5% |
| Immigrants | Zaire | 57.4 /100 | #170 | Average 4.5% |
Demographics Similar to Immigrants from West Indies by Professional Degree
In terms of professional degree, the demographic groups most similar to Immigrants from West Indies are Immigrants from Burma/Myanmar (3.9%, a difference of 0.14%), Cuban (4.0%, a difference of 0.25%), German Russian (4.0%, a difference of 0.37%), Nicaraguan (3.9%, a difference of 0.42%), and Ecuadorian (3.9%, a difference of 0.87%).
| Demographics | Rating | Rank | Professional Degree |
| French Canadians | 8.0 /100 | #221 | Tragic 4.0% |
| Immigrants | Western Africa | 7.5 /100 | #222 | Tragic 4.0% |
| Immigrants | Bosnia and Herzegovina | 7.4 /100 | #223 | Tragic 4.0% |
| Trinidadians and Tobagonians | 7.1 /100 | #224 | Tragic 4.0% |
| Tlingit-Haida | 6.9 /100 | #225 | Tragic 4.0% |
| German Russians | 6.1 /100 | #226 | Tragic 4.0% |
| Cubans | 5.9 /100 | #227 | Tragic 4.0% |
| Immigrants | West Indies | 5.6 /100 | #228 | Tragic 4.0% |
| Immigrants | Burma/Myanmar | 5.4 /100 | #229 | Tragic 3.9% |
| Nicaraguans | 5.1 /100 | #230 | Tragic 3.9% |
| Ecuadorians | 4.6 /100 | #231 | Tragic 3.9% |
| Cree | 4.3 /100 | #232 | Tragic 3.9% |
| Immigrants | Philippines | 4.1 /100 | #233 | Tragic 3.9% |
| Immigrants | Nonimmigrants | 4.0 /100 | #234 | Tragic 3.9% |
| Immigrants | Barbados | 4.0 /100 | #235 | Tragic 3.9% |