Immigrants from Greece vs Immigrants from Turkey No Schooling Completed
COMPARE
Immigrants from Greece
Immigrants from Turkey
No Schooling Completed
No Schooling Completed Comparison
Immigrants from Greece
Immigrants from Turkey
2.0%
NO SCHOOLING COMPLETED
83.5/ 100
METRIC RATING
141st/ 347
METRIC RANK
1.9%
NO SCHOOLING COMPLETED
90.2/ 100
METRIC RATING
133rd/ 347
METRIC RANK
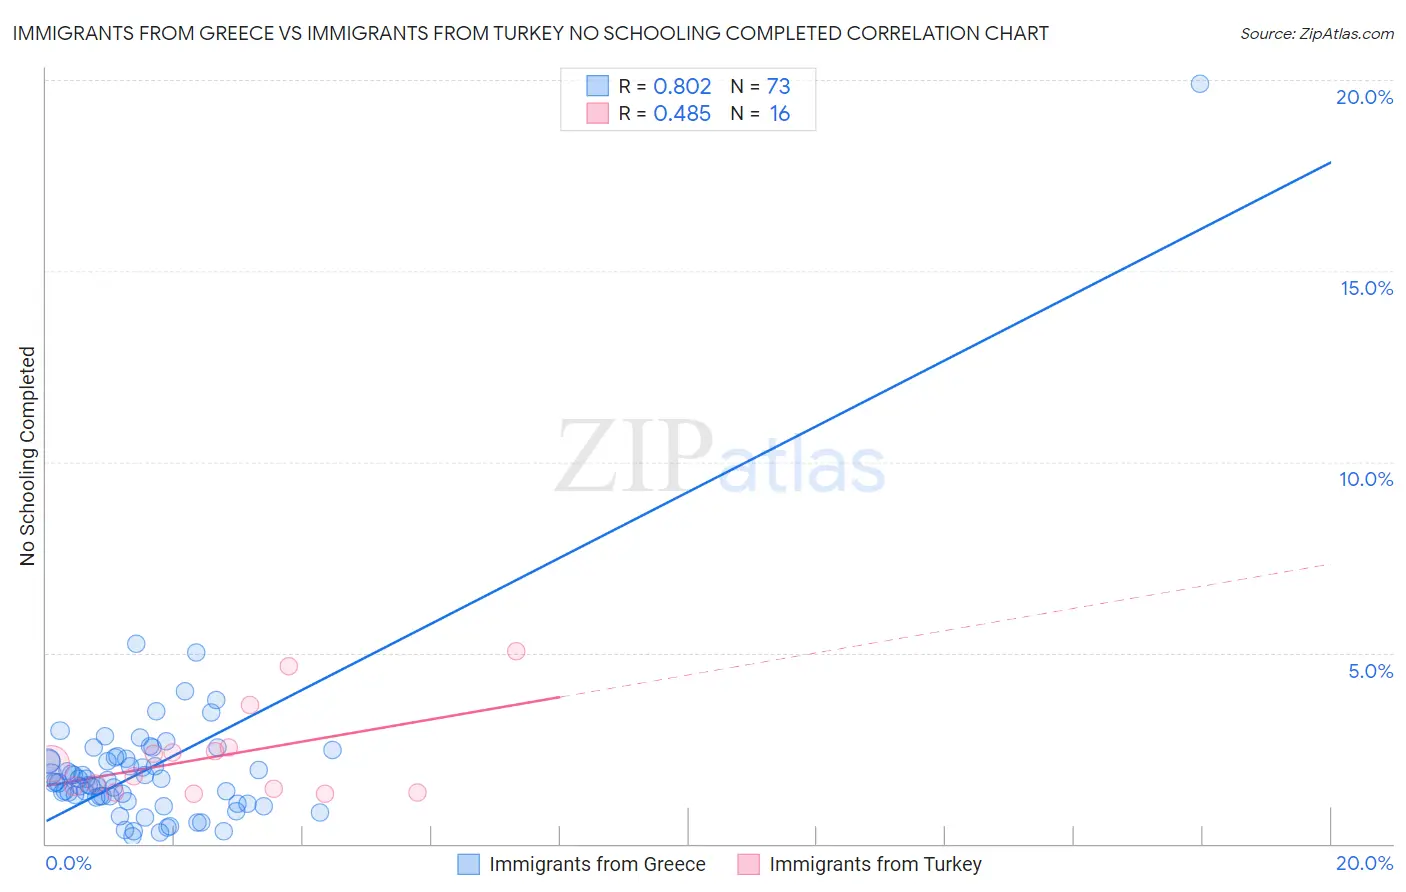
Immigrants from Greece vs Immigrants from Turkey No Schooling Completed Correlation Chart
The statistical analysis conducted on geographies consisting of 215,786,683 people shows a very strong positive correlation between the proportion of Immigrants from Greece and percentage of population with no schooling in the United States with a correlation coefficient (R) of 0.802 and weighted average of 2.0%. Similarly, the statistical analysis conducted on geographies consisting of 221,912,605 people shows a moderate positive correlation between the proportion of Immigrants from Turkey and percentage of population with no schooling in the United States with a correlation coefficient (R) of 0.485 and weighted average of 1.9%, a difference of 2.2%.
No Schooling Completed Correlation Summary
| Measurement | Immigrants from Greece | Immigrants from Turkey |
| Minimum | 0.20% | 1.3% |
| Maximum | 19.9% | 5.0% |
| Range | 19.7% | 3.7% |
| Mean | 2.0% | 2.3% |
| Median | 1.6% | 1.9% |
| Interquartile 25% (IQ1) | 1.2% | 1.4% |
| Interquartile 75% (IQ3) | 2.2% | 2.5% |
| Interquartile Range (IQR) | 1.1% | 1.1% |
| Standard Deviation (Sample) | 2.3% | 1.2% |
| Standard Deviation (Population) | 2.3% | 1.1% |
Demographics Similar to Immigrants from Greece and Immigrants from Turkey by No Schooling Completed
In terms of no schooling completed, the demographic groups most similar to Immigrants from Greece are Marshallese (2.0%, a difference of 0.010%), Jordanian (2.0%, a difference of 0.27%), Venezuelan (2.0%, a difference of 0.49%), Immigrants from Israel (2.0%, a difference of 0.52%), and Filipino (2.0%, a difference of 0.56%). Similarly, the demographic groups most similar to Immigrants from Turkey are Colville (1.9%, a difference of 0.10%), Menominee (1.9%, a difference of 0.25%), Immigrants from Hungary (1.9%, a difference of 0.60%), Hmong (1.9%, a difference of 0.65%), and Palestinian (1.9%, a difference of 0.71%).
| Demographics | Rating | Rank | No Schooling Completed |
| Israelis | 92.4 /100 | #127 | Exceptional 1.9% |
| Spaniards | 92.3 /100 | #128 | Exceptional 1.9% |
| Seminole | 92.0 /100 | #129 | Exceptional 1.9% |
| Palestinians | 91.8 /100 | #130 | Exceptional 1.9% |
| Immigrants | Hungary | 91.6 /100 | #131 | Exceptional 1.9% |
| Colville | 90.4 /100 | #132 | Exceptional 1.9% |
| Immigrants | Turkey | 90.2 /100 | #133 | Exceptional 1.9% |
| Menominee | 89.6 /100 | #134 | Excellent 1.9% |
| Hmong | 88.5 /100 | #135 | Excellent 1.9% |
| Burmese | 88.2 /100 | #136 | Excellent 1.9% |
| Filipinos | 85.5 /100 | #137 | Excellent 2.0% |
| Immigrants | Israel | 85.4 /100 | #138 | Excellent 2.0% |
| Jordanians | 84.5 /100 | #139 | Excellent 2.0% |
| Marshallese | 83.5 /100 | #140 | Excellent 2.0% |
| Immigrants | Greece | 83.5 /100 | #141 | Excellent 2.0% |
| Venezuelans | 81.5 /100 | #142 | Excellent 2.0% |
| Immigrants | South Central Asia | 80.0 /100 | #143 | Good 2.0% |
| Alsatians | 79.1 /100 | #144 | Good 2.0% |
| Immigrants | Iran | 79.0 /100 | #145 | Good 2.0% |
| Immigrants | Moldova | 78.0 /100 | #146 | Good 2.0% |
| Soviet Union | 77.1 /100 | #147 | Good 2.0% |