Immigrants from Israel vs Immigrants from Bulgaria 3rd Grade
COMPARE
Immigrants from Israel
Immigrants from Bulgaria
3rd Grade
3rd Grade Comparison
Immigrants from Israel
Immigrants from Bulgaria
97.9%
3RD GRADE
77.3/ 100
METRIC RATING
147th/ 347
METRIC RANK
97.9%
3RD GRADE
89.1/ 100
METRIC RATING
131st/ 347
METRIC RANK
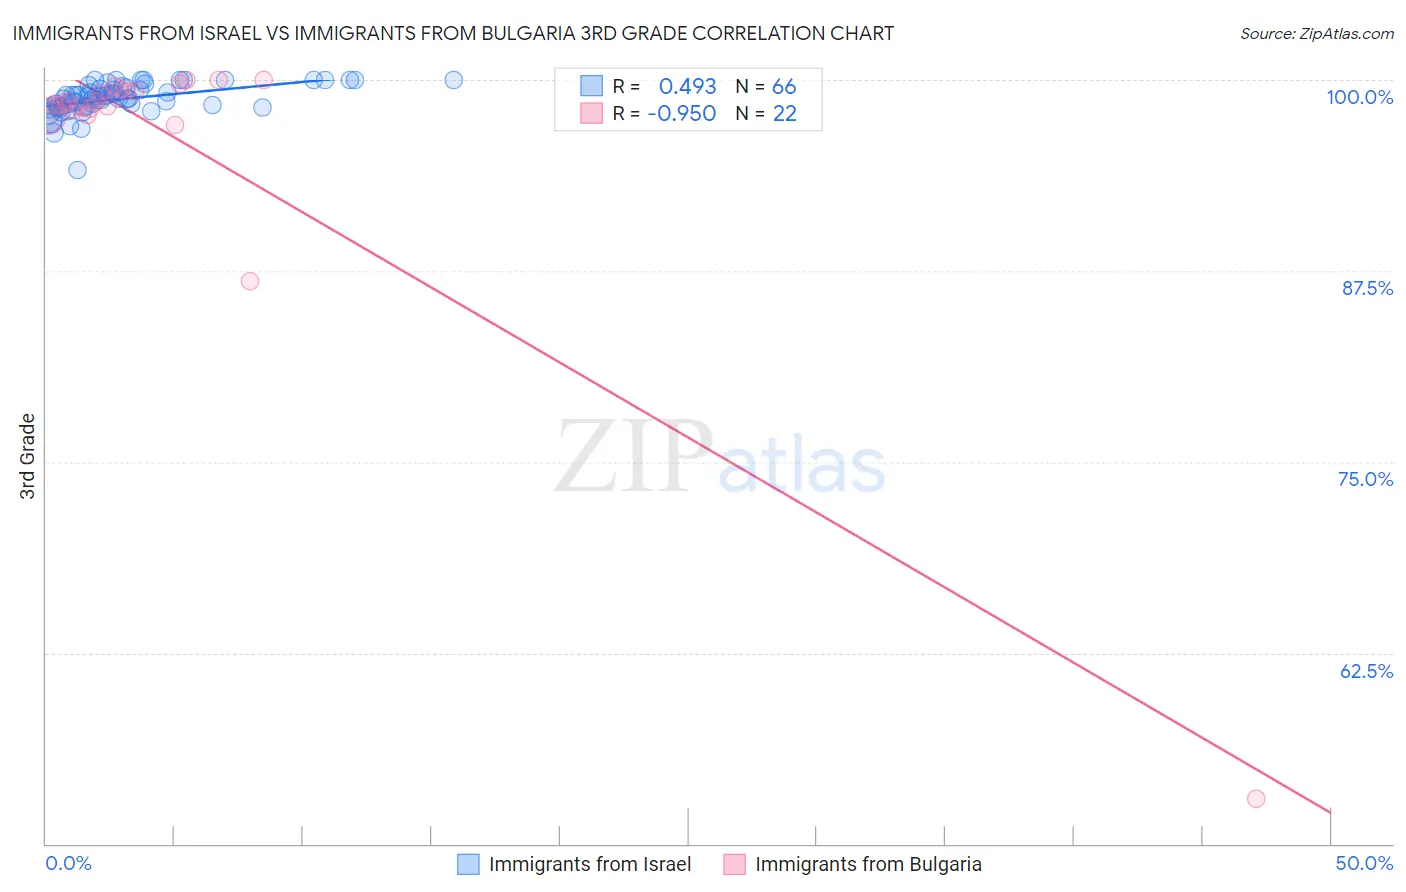
Immigrants from Israel vs Immigrants from Bulgaria 3rd Grade Correlation Chart
The statistical analysis conducted on geographies consisting of 210,029,773 people shows a moderate positive correlation between the proportion of Immigrants from Israel and percentage of population with at least 3rd grade education in the United States with a correlation coefficient (R) of 0.493 and weighted average of 97.9%. Similarly, the statistical analysis conducted on geographies consisting of 172,552,181 people shows a perfect negative correlation between the proportion of Immigrants from Bulgaria and percentage of population with at least 3rd grade education in the United States with a correlation coefficient (R) of -0.950 and weighted average of 97.9%, a difference of 0.070%.
3rd Grade Correlation Summary
| Measurement | Immigrants from Israel | Immigrants from Bulgaria |
| Minimum | 94.1% | 52.9% |
| Maximum | 100.0% | 100.0% |
| Range | 5.9% | 47.1% |
| Mean | 98.8% | 96.1% |
| Median | 98.8% | 98.5% |
| Interquartile 25% (IQ1) | 98.3% | 98.1% |
| Interquartile 75% (IQ3) | 99.5% | 99.4% |
| Interquartile Range (IQR) | 1.3% | 1.3% |
| Standard Deviation (Sample) | 1.0% | 10.0% |
| Standard Deviation (Population) | 1.0% | 9.8% |
Demographics Similar to Immigrants from Israel and Immigrants from Bulgaria by 3rd Grade
In terms of 3rd grade, the demographic groups most similar to Immigrants from Israel are Alsatian (97.9%, a difference of 0.0%), Immigrants from Moldova (97.9%, a difference of 0.0%), Filipino (97.9%, a difference of 0.010%), Burmese (97.9%, a difference of 0.010%), and Immigrants from Greece (97.9%, a difference of 0.010%). Similarly, the demographic groups most similar to Immigrants from Bulgaria are Immigrants from Hungary (97.9%, a difference of 0.0%), Immigrants from Kuwait (97.9%, a difference of 0.0%), Seminole (97.9%, a difference of 0.0%), Cambodian (97.9%, a difference of 0.010%), and Spaniard (97.9%, a difference of 0.010%).
| Demographics | Rating | Rank | 3rd Grade |
| Immigrants | Serbia | 91.9 /100 | #129 | Exceptional 98.0% |
| Immigrants | Europe | 91.2 /100 | #130 | Exceptional 98.0% |
| Immigrants | Bulgaria | 89.1 /100 | #131 | Excellent 97.9% |
| Immigrants | Hungary | 88.8 /100 | #132 | Excellent 97.9% |
| Immigrants | Kuwait | 88.7 /100 | #133 | Excellent 97.9% |
| Seminole | 88.7 /100 | #134 | Excellent 97.9% |
| Cambodians | 88.1 /100 | #135 | Excellent 97.9% |
| Spaniards | 87.9 /100 | #136 | Excellent 97.9% |
| Immigrants | Romania | 87.9 /100 | #137 | Excellent 97.9% |
| Israelis | 86.6 /100 | #138 | Excellent 97.9% |
| Blackfeet | 86.3 /100 | #139 | Excellent 97.9% |
| Palestinians | 84.6 /100 | #140 | Excellent 97.9% |
| Immigrants | Turkey | 83.5 /100 | #141 | Excellent 97.9% |
| Hmong | 80.3 /100 | #142 | Excellent 97.9% |
| Filipinos | 79.9 /100 | #143 | Good 97.9% |
| Burmese | 79.6 /100 | #144 | Good 97.9% |
| Immigrants | Greece | 79.5 /100 | #145 | Good 97.9% |
| Alsatians | 78.3 /100 | #146 | Good 97.9% |
| Immigrants | Israel | 77.3 /100 | #147 | Good 97.9% |
| Immigrants | Moldova | 77.1 /100 | #148 | Good 97.9% |
| Immigrants | North Macedonia | 74.5 /100 | #149 | Good 97.8% |