Native/Alaskan vs Yaqui 9th Grade
COMPARE
Native/Alaskan
Yaqui
9th Grade
9th Grade Comparison
Natives/Alaskans
Yaqui
93.9%
9TH GRADE
0.4/ 100
METRIC RATING
265th/ 347
METRIC RANK
92.9%
9TH GRADE
0.0/ 100
METRIC RATING
300th/ 347
METRIC RANK
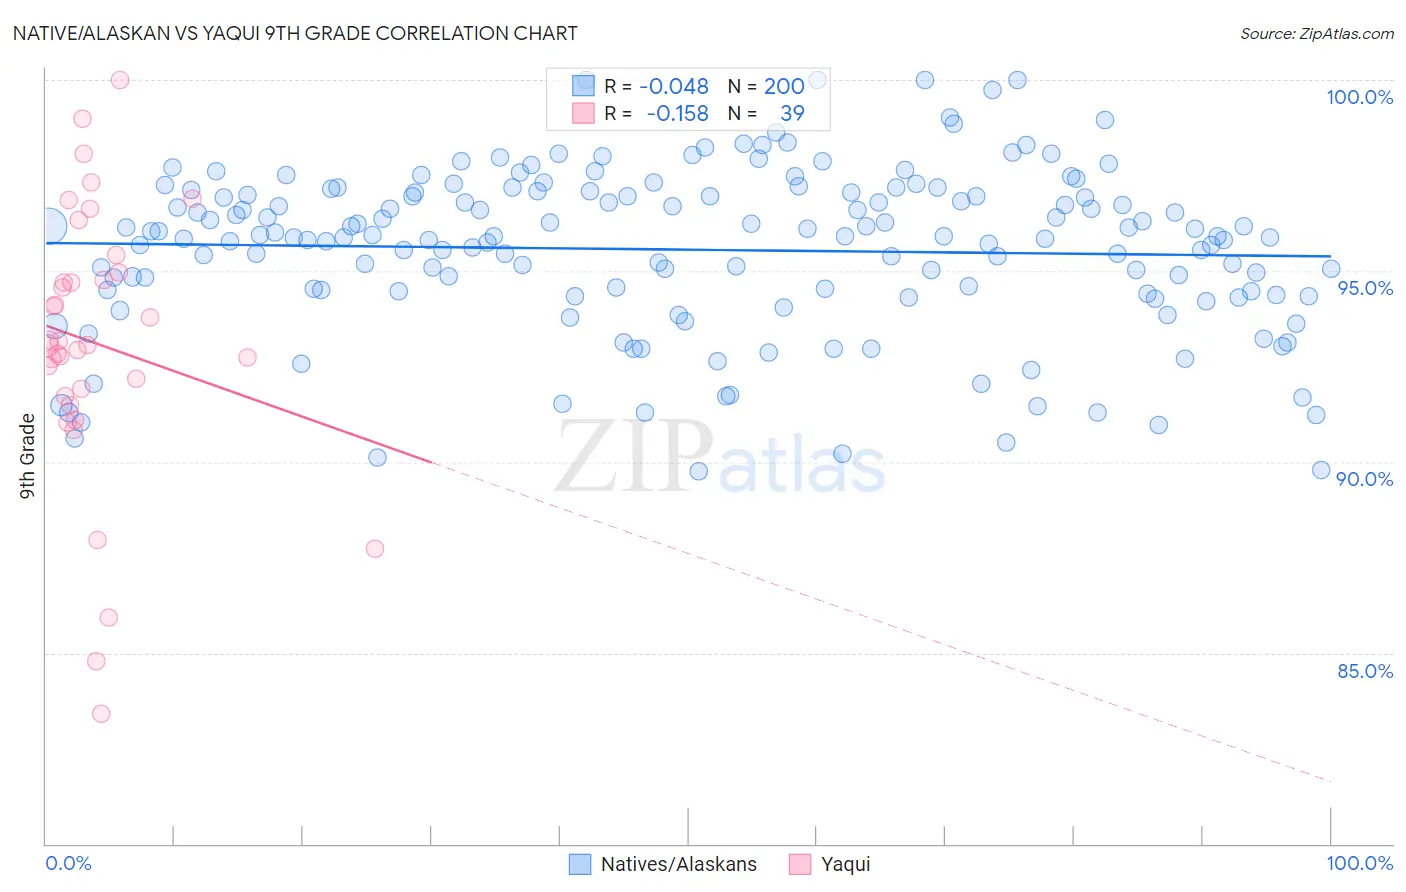
Native/Alaskan vs Yaqui 9th Grade Correlation Chart
The statistical analysis conducted on geographies consisting of 513,075,822 people shows no correlation between the proportion of Natives/Alaskans and percentage of population with at least 9th grade education in the United States with a correlation coefficient (R) of -0.048 and weighted average of 93.9%. Similarly, the statistical analysis conducted on geographies consisting of 107,725,021 people shows a poor negative correlation between the proportion of Yaqui and percentage of population with at least 9th grade education in the United States with a correlation coefficient (R) of -0.158 and weighted average of 92.9%, a difference of 1.1%.
9th Grade Correlation Summary
| Measurement | Native/Alaskan | Yaqui |
| Minimum | 89.8% | 83.4% |
| Maximum | 100.0% | 100.0% |
| Range | 10.2% | 16.6% |
| Mean | 95.6% | 93.1% |
| Median | 95.9% | 93.1% |
| Interquartile 25% (IQ1) | 94.4% | 91.7% |
| Interquartile 75% (IQ3) | 97.1% | 94.9% |
| Interquartile Range (IQR) | 2.6% | 3.2% |
| Standard Deviation (Sample) | 2.2% | 3.6% |
| Standard Deviation (Population) | 2.2% | 3.5% |
Similar Demographics by 9th Grade
Demographics Similar to Natives/Alaskans by 9th Grade
In terms of 9th grade, the demographic groups most similar to Natives/Alaskans are Immigrants from Congo (93.9%, a difference of 0.0%), Immigrants from Jamaica (93.9%, a difference of 0.010%), Immigrants from Uzbekistan (93.9%, a difference of 0.010%), Navajo (93.9%, a difference of 0.010%), and South American (93.9%, a difference of 0.030%).
| Demographics | Rating | Rank | 9th Grade |
| Immigrants | Thailand | 0.5 /100 | #258 | Tragic 93.9% |
| Ghanaians | 0.5 /100 | #259 | Tragic 93.9% |
| Pima | 0.4 /100 | #260 | Tragic 93.9% |
| South Americans | 0.4 /100 | #261 | Tragic 93.9% |
| Immigrants | Jamaica | 0.4 /100 | #262 | Tragic 93.9% |
| Immigrants | Uzbekistan | 0.4 /100 | #263 | Tragic 93.9% |
| Immigrants | Congo | 0.4 /100 | #264 | Tragic 93.9% |
| Natives/Alaskans | 0.4 /100 | #265 | Tragic 93.9% |
| Navajo | 0.3 /100 | #266 | Tragic 93.9% |
| Armenians | 0.3 /100 | #267 | Tragic 93.9% |
| Immigrants | Bolivia | 0.3 /100 | #268 | Tragic 93.9% |
| Immigrants | Uruguay | 0.2 /100 | #269 | Tragic 93.8% |
| Yuman | 0.2 /100 | #270 | Tragic 93.8% |
| Immigrants | Ghana | 0.2 /100 | #271 | Tragic 93.8% |
| Immigrants | Western Africa | 0.2 /100 | #272 | Tragic 93.8% |
Demographics Similar to Yaqui by 9th Grade
In terms of 9th grade, the demographic groups most similar to Yaqui are Immigrants from Grenada (93.0%, a difference of 0.13%), Immigrants from Haiti (92.7%, a difference of 0.17%), Haitian (93.1%, a difference of 0.20%), Fijian (93.1%, a difference of 0.22%), and Immigrants from Dominica (92.7%, a difference of 0.25%).
| Demographics | Rating | Rank | 9th Grade |
| Sri Lankans | 0.0 /100 | #293 | Tragic 93.2% |
| Cubans | 0.0 /100 | #294 | Tragic 93.2% |
| Immigrants | Burma/Myanmar | 0.0 /100 | #295 | Tragic 93.1% |
| Indonesians | 0.0 /100 | #296 | Tragic 93.1% |
| Fijians | 0.0 /100 | #297 | Tragic 93.1% |
| Haitians | 0.0 /100 | #298 | Tragic 93.1% |
| Immigrants | Grenada | 0.0 /100 | #299 | Tragic 93.0% |
| Yaqui | 0.0 /100 | #300 | Tragic 92.9% |
| Immigrants | Haiti | 0.0 /100 | #301 | Tragic 92.7% |
| Immigrants | Dominica | 0.0 /100 | #302 | Tragic 92.7% |
| Guyanese | 0.0 /100 | #303 | Tragic 92.7% |
| Tohono O'odham | 0.0 /100 | #304 | Tragic 92.6% |
| Japanese | 0.0 /100 | #305 | Tragic 92.6% |
| Immigrants | Vietnam | 0.0 /100 | #306 | Tragic 92.6% |
| Immigrants | Immigrants | 0.0 /100 | #307 | Tragic 92.5% |