Cape Verdean vs Menominee Professional Degree
COMPARE
Cape Verdean
Menominee
Professional Degree
Professional Degree Comparison
Cape Verdeans
Menominee
3.4%
PROFESSIONAL DEGREE
0.1/ 100
METRIC RATING
306th/ 347
METRIC RANK
3.1%
PROFESSIONAL DEGREE
0.0/ 100
METRIC RATING
326th/ 347
METRIC RANK
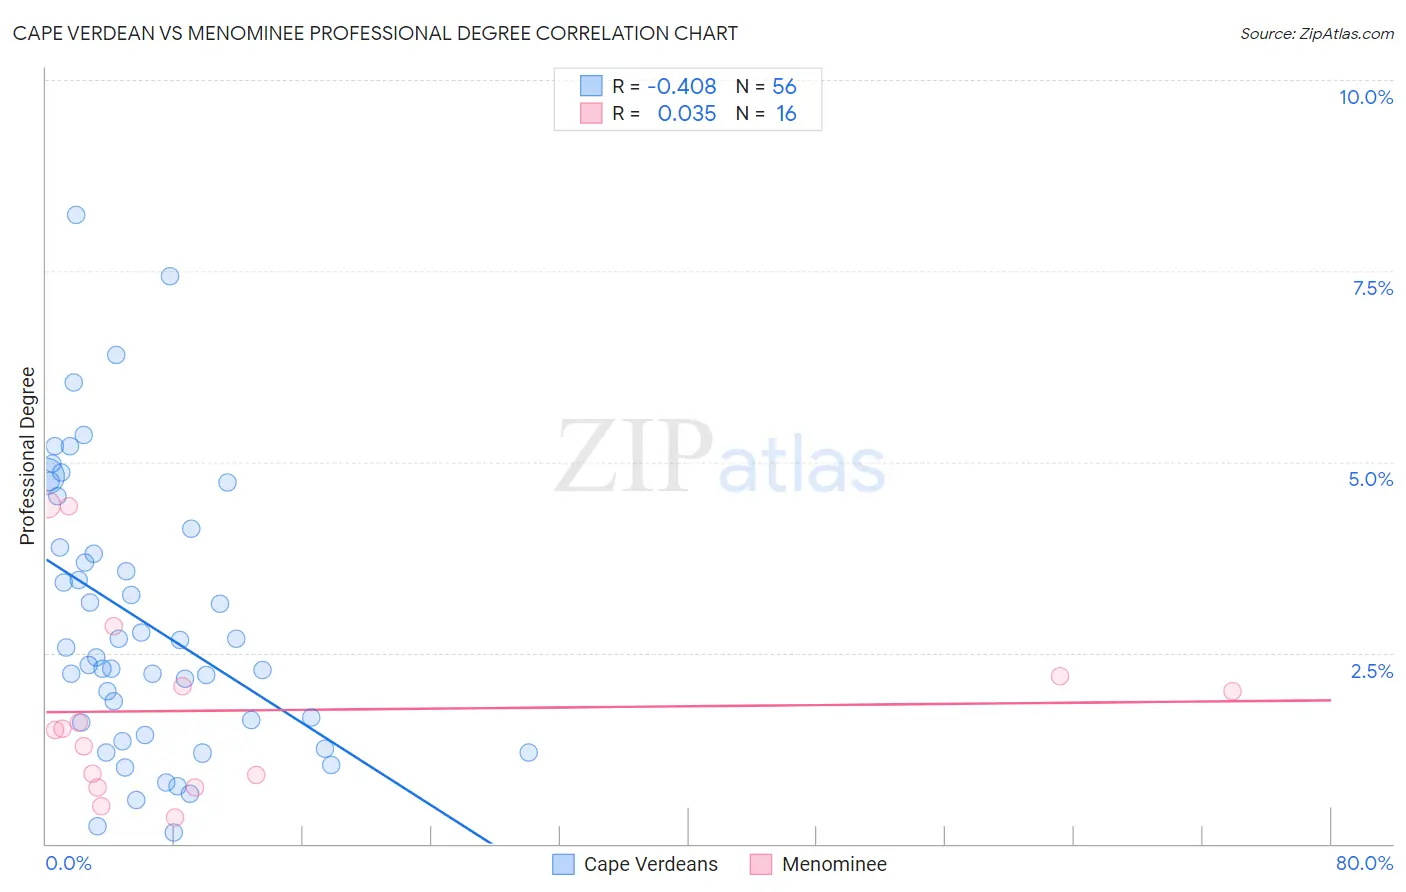
Cape Verdean vs Menominee Professional Degree Correlation Chart
The statistical analysis conducted on geographies consisting of 107,527,717 people shows a moderate negative correlation between the proportion of Cape Verdeans and percentage of population with at least professional degree education in the United States with a correlation coefficient (R) of -0.408 and weighted average of 3.4%. Similarly, the statistical analysis conducted on geographies consisting of 45,721,349 people shows no correlation between the proportion of Menominee and percentage of population with at least professional degree education in the United States with a correlation coefficient (R) of 0.035 and weighted average of 3.1%, a difference of 8.4%.
Professional Degree Correlation Summary
| Measurement | Cape Verdean | Menominee |
| Minimum | 0.14% | 0.35% |
| Maximum | 8.2% | 4.4% |
| Range | 8.1% | 4.1% |
| Mean | 2.9% | 1.7% |
| Median | 2.5% | 1.5% |
| Interquartile 25% (IQ1) | 1.5% | 0.82% |
| Interquartile 75% (IQ3) | 4.0% | 2.1% |
| Interquartile Range (IQR) | 2.5% | 1.3% |
| Standard Deviation (Sample) | 1.8% | 1.2% |
| Standard Deviation (Population) | 1.8% | 1.2% |
Demographics Similar to Cape Verdeans and Menominee by Professional Degree
In terms of professional degree, the demographic groups most similar to Cape Verdeans are Samoan (3.3%, a difference of 1.1%), Shoshone (3.3%, a difference of 1.6%), Pima (3.3%, a difference of 1.6%), Immigrants from Latin America (3.3%, a difference of 1.9%), and Cherokee (3.3%, a difference of 2.1%). Similarly, the demographic groups most similar to Menominee are Yaqui (3.2%, a difference of 1.8%), Crow (3.2%, a difference of 1.8%), Inupiat (3.2%, a difference of 2.1%), Hispanic or Latino (3.2%, a difference of 2.2%), and Tsimshian (3.2%, a difference of 2.6%).
| Demographics | Rating | Rank | Professional Degree |
| Cape Verdeans | 0.1 /100 | #306 | Tragic 3.4% |
| Samoans | 0.1 /100 | #307 | Tragic 3.3% |
| Shoshone | 0.1 /100 | #308 | Tragic 3.3% |
| Pima | 0.1 /100 | #309 | Tragic 3.3% |
| Immigrants | Latin America | 0.1 /100 | #310 | Tragic 3.3% |
| Cherokee | 0.1 /100 | #311 | Tragic 3.3% |
| Sioux | 0.1 /100 | #312 | Tragic 3.3% |
| Yuman | 0.1 /100 | #313 | Tragic 3.3% |
| Mexican American Indians | 0.1 /100 | #314 | Tragic 3.3% |
| Immigrants | Laos | 0.1 /100 | #315 | Tragic 3.2% |
| Puerto Ricans | 0.1 /100 | #316 | Tragic 3.2% |
| Nepalese | 0.1 /100 | #317 | Tragic 3.2% |
| Immigrants | Micronesia | 0.1 /100 | #318 | Tragic 3.2% |
| Choctaw | 0.1 /100 | #319 | Tragic 3.2% |
| Seminole | 0.1 /100 | #320 | Tragic 3.2% |
| Tsimshian | 0.0 /100 | #321 | Tragic 3.2% |
| Hispanics or Latinos | 0.0 /100 | #322 | Tragic 3.2% |
| Inupiat | 0.0 /100 | #323 | Tragic 3.2% |
| Crow | 0.0 /100 | #324 | Tragic 3.2% |
| Yaqui | 0.0 /100 | #325 | Tragic 3.2% |
| Menominee | 0.0 /100 | #326 | Tragic 3.1% |