Native Hawaiian vs Cypriot 5th Grade
COMPARE
Native Hawaiian
Cypriot
5th Grade
5th Grade Comparison
Native Hawaiians
Cypriots
98.0%
5TH GRADE
99.9/ 100
METRIC RATING
47th/ 347
METRIC RANK
97.8%
5TH GRADE
98.9/ 100
METRIC RATING
86th/ 347
METRIC RANK
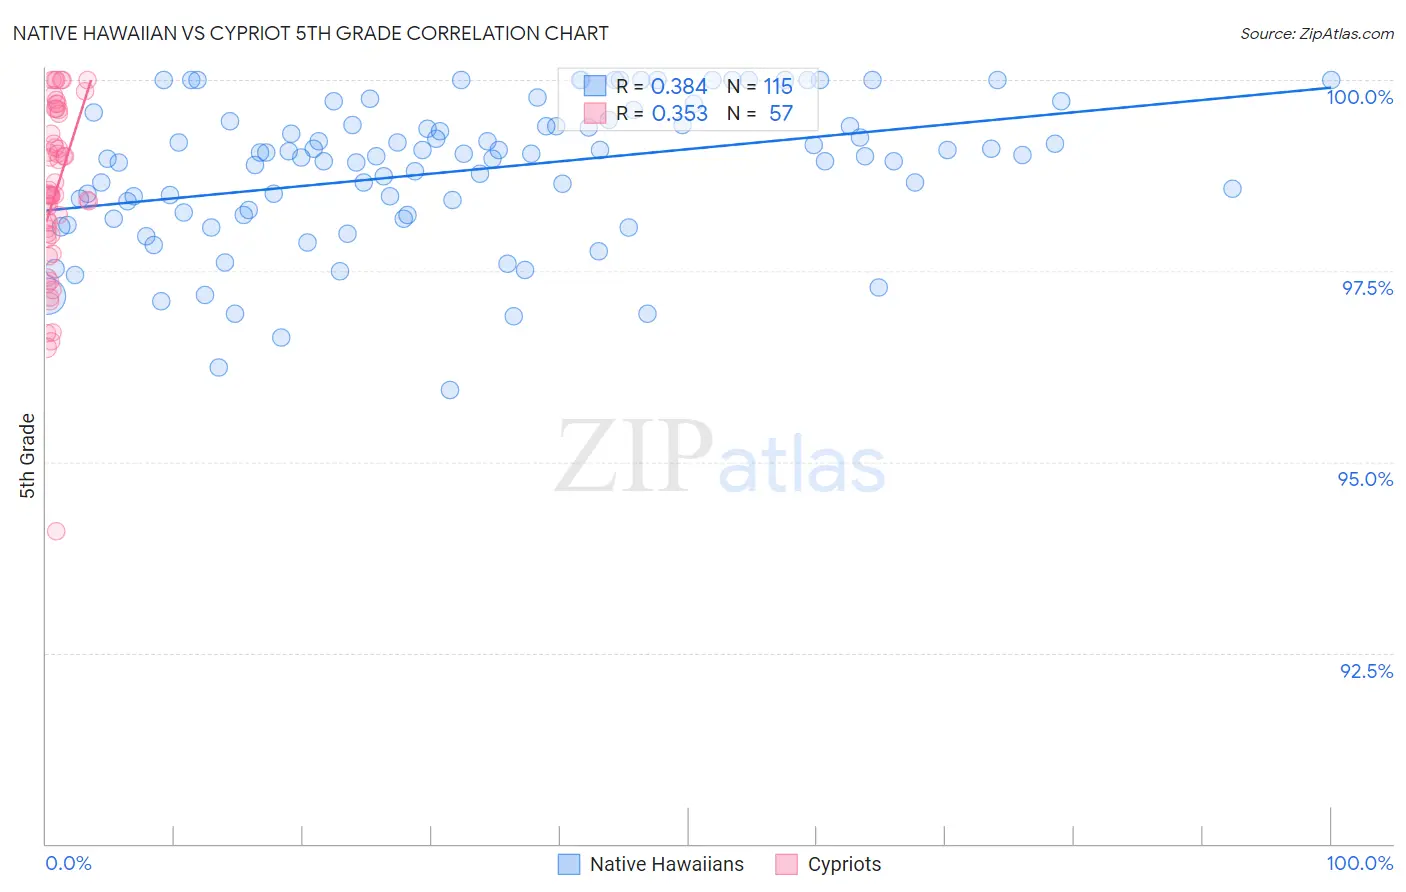
Native Hawaiian vs Cypriot 5th Grade Correlation Chart
The statistical analysis conducted on geographies consisting of 332,113,170 people shows a mild positive correlation between the proportion of Native Hawaiians and percentage of population with at least 5th grade education in the United States with a correlation coefficient (R) of 0.384 and weighted average of 98.0%. Similarly, the statistical analysis conducted on geographies consisting of 61,870,289 people shows a mild positive correlation between the proportion of Cypriots and percentage of population with at least 5th grade education in the United States with a correlation coefficient (R) of 0.353 and weighted average of 97.8%, a difference of 0.21%.
5th Grade Correlation Summary
| Measurement | Native Hawaiian | Cypriot |
| Minimum | 95.9% | 94.1% |
| Maximum | 100.0% | 100.0% |
| Range | 4.1% | 5.9% |
| Mean | 98.8% | 98.5% |
| Median | 99.0% | 98.5% |
| Interquartile 25% (IQ1) | 98.2% | 97.9% |
| Interquartile 75% (IQ3) | 99.4% | 99.6% |
| Interquartile Range (IQR) | 1.2% | 1.6% |
| Standard Deviation (Sample) | 0.93% | 1.2% |
| Standard Deviation (Population) | 0.93% | 1.1% |
Similar Demographics by 5th Grade
Demographics Similar to Native Hawaiians by 5th Grade
In terms of 5th grade, the demographic groups most similar to Native Hawaiians are Czechoslovakian (98.0%, a difference of 0.010%), Arapaho (98.0%, a difference of 0.010%), Bulgarian (98.0%, a difference of 0.010%), Aleut (98.0%, a difference of 0.020%), and Estonian (98.0%, a difference of 0.020%).
| Demographics | Rating | Rank | 5th Grade |
| Eastern Europeans | 99.9 /100 | #40 | Exceptional 98.1% |
| Hungarians | 99.9 /100 | #41 | Exceptional 98.0% |
| Northern Europeans | 99.9 /100 | #42 | Exceptional 98.0% |
| Ottawa | 99.9 /100 | #43 | Exceptional 98.0% |
| Aleuts | 99.9 /100 | #44 | Exceptional 98.0% |
| Czechoslovakians | 99.9 /100 | #45 | Exceptional 98.0% |
| Arapaho | 99.9 /100 | #46 | Exceptional 98.0% |
| Native Hawaiians | 99.9 /100 | #47 | Exceptional 98.0% |
| Bulgarians | 99.8 /100 | #48 | Exceptional 98.0% |
| Estonians | 99.8 /100 | #49 | Exceptional 98.0% |
| Immigrants | Scotland | 99.8 /100 | #50 | Exceptional 98.0% |
| Celtics | 99.8 /100 | #51 | Exceptional 98.0% |
| Maltese | 99.8 /100 | #52 | Exceptional 98.0% |
| Slavs | 99.8 /100 | #53 | Exceptional 98.0% |
| Australians | 99.8 /100 | #54 | Exceptional 98.0% |
Demographics Similar to Cypriots by 5th Grade
In terms of 5th grade, the demographic groups most similar to Cypriots are Zimbabwean (97.8%, a difference of 0.010%), Potawatomi (97.8%, a difference of 0.010%), Immigrants from Belgium (97.8%, a difference of 0.010%), Immigrants from Australia (97.8%, a difference of 0.010%), and Shoshone (97.8%, a difference of 0.010%).
| Demographics | Rating | Rank | 5th Grade |
| Immigrants | Lithuania | 99.2 /100 | #79 | Exceptional 97.8% |
| Immigrants | India | 99.2 /100 | #80 | Exceptional 97.8% |
| Icelanders | 99.2 /100 | #81 | Exceptional 97.8% |
| Pueblo | 99.2 /100 | #82 | Exceptional 97.8% |
| Zimbabweans | 99.0 /100 | #83 | Exceptional 97.8% |
| Potawatomi | 99.0 /100 | #84 | Exceptional 97.8% |
| Immigrants | Belgium | 99.0 /100 | #85 | Exceptional 97.8% |
| Cypriots | 98.9 /100 | #86 | Exceptional 97.8% |
| Immigrants | Australia | 98.8 /100 | #87 | Exceptional 97.8% |
| Shoshone | 98.8 /100 | #88 | Exceptional 97.8% |
| Immigrants | South Africa | 98.8 /100 | #89 | Exceptional 97.8% |
| Immigrants | Ireland | 98.8 /100 | #90 | Exceptional 97.8% |
| Immigrants | Western Europe | 98.8 /100 | #91 | Exceptional 97.8% |
| Immigrants | Sweden | 98.7 /100 | #92 | Exceptional 97.8% |
| Delaware | 98.6 /100 | #93 | Exceptional 97.8% |