Immigrants from Jordan vs Immigrants from Switzerland 4th Grade
COMPARE
Immigrants from Jordan
Immigrants from Switzerland
4th Grade
4th Grade Comparison
Immigrants from Jordan
Immigrants from Switzerland
97.6%
4TH GRADE
66.9/ 100
METRIC RATING
156th/ 347
METRIC RANK
97.8%
4TH GRADE
96.1/ 100
METRIC RATING
111th/ 347
METRIC RANK
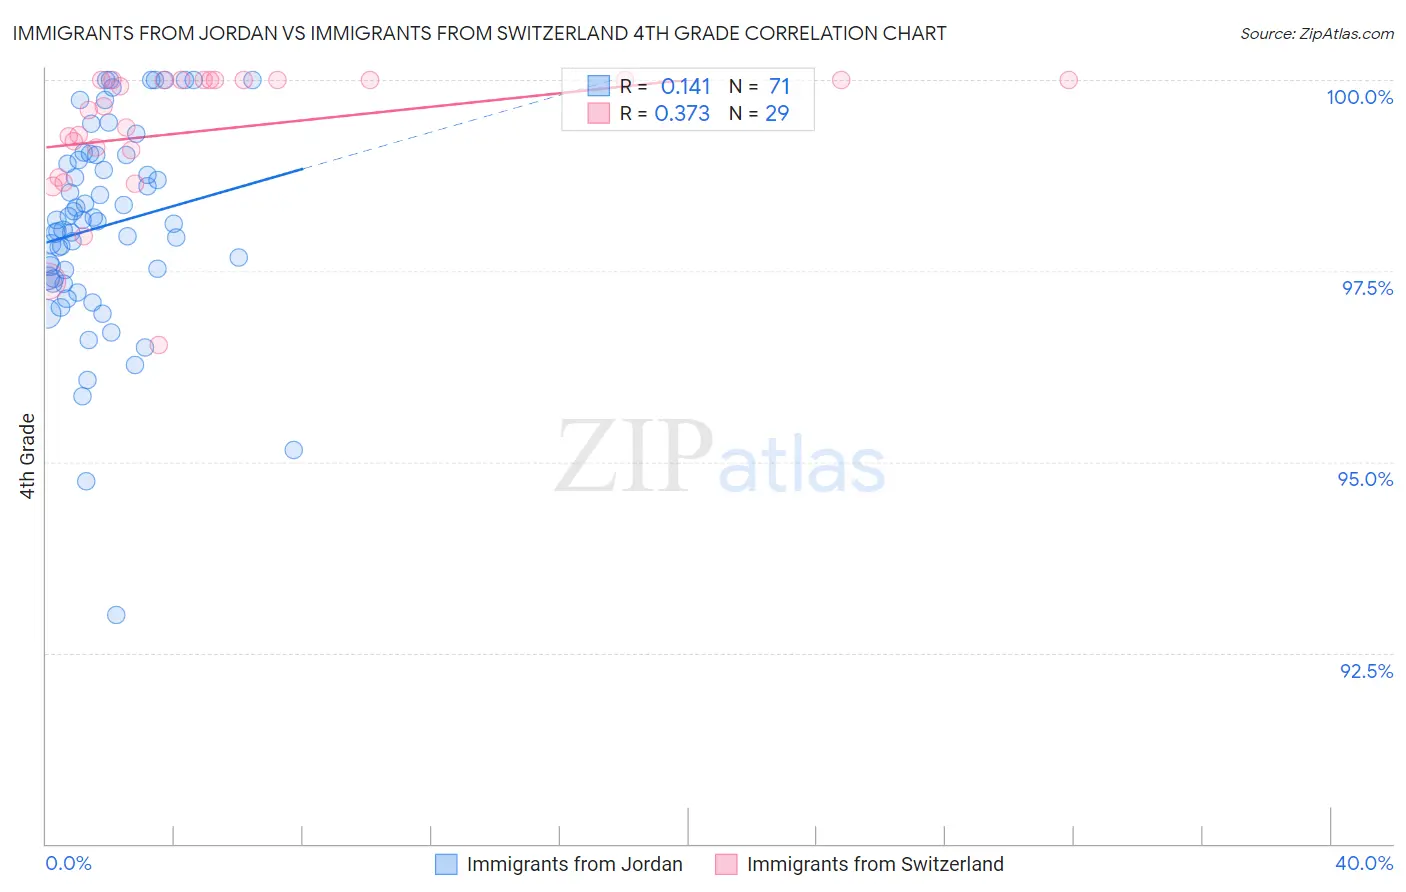
Immigrants from Jordan vs Immigrants from Switzerland 4th Grade Correlation Chart
The statistical analysis conducted on geographies consisting of 181,269,915 people shows a poor positive correlation between the proportion of Immigrants from Jordan and percentage of population with at least 4th grade education in the United States with a correlation coefficient (R) of 0.141 and weighted average of 97.6%. Similarly, the statistical analysis conducted on geographies consisting of 148,082,451 people shows a mild positive correlation between the proportion of Immigrants from Switzerland and percentage of population with at least 4th grade education in the United States with a correlation coefficient (R) of 0.373 and weighted average of 97.8%, a difference of 0.24%.
4th Grade Correlation Summary
| Measurement | Immigrants from Jordan | Immigrants from Switzerland |
| Minimum | 93.0% | 96.5% |
| Maximum | 100.0% | 100.0% |
| Range | 7.0% | 3.5% |
| Mean | 98.1% | 99.3% |
| Median | 98.2% | 99.7% |
| Interquartile 25% (IQ1) | 97.4% | 98.9% |
| Interquartile 75% (IQ3) | 99.0% | 100.0% |
| Interquartile Range (IQR) | 1.6% | 1.1% |
| Standard Deviation (Sample) | 1.3% | 0.88% |
| Standard Deviation (Population) | 1.3% | 0.87% |
Similar Demographics by 4th Grade
Demographics Similar to Immigrants from Jordan by 4th Grade
In terms of 4th grade, the demographic groups most similar to Immigrants from Jordan are Immigrants from Russia (97.6%, a difference of 0.0%), Albanian (97.6%, a difference of 0.0%), Immigrants from Bosnia and Herzegovina (97.6%, a difference of 0.0%), French American Indian (97.6%, a difference of 0.0%), and Immigrants from Italy (97.6%, a difference of 0.010%).
| Demographics | Rating | Rank | 4th Grade |
| Soviet Union | 77.8 /100 | #149 | Good 97.6% |
| Immigrants | Israel | 77.7 /100 | #150 | Good 97.6% |
| Alsatians | 77.2 /100 | #151 | Good 97.6% |
| Immigrants | South Central Asia | 76.2 /100 | #152 | Good 97.6% |
| Immigrants | Eastern Europe | 71.3 /100 | #153 | Good 97.6% |
| Immigrants | Russia | 67.0 /100 | #154 | Good 97.6% |
| Albanians | 67.0 /100 | #155 | Good 97.6% |
| Immigrants | Jordan | 66.9 /100 | #156 | Good 97.6% |
| Immigrants | Bosnia and Herzegovina | 66.0 /100 | #157 | Good 97.6% |
| French American Indians | 65.9 /100 | #158 | Good 97.6% |
| Immigrants | Italy | 63.7 /100 | #159 | Good 97.6% |
| Apache | 61.3 /100 | #160 | Good 97.6% |
| Marshallese | 60.8 /100 | #161 | Good 97.6% |
| Bermudans | 60.5 /100 | #162 | Good 97.6% |
| Immigrants | Iran | 60.3 /100 | #163 | Good 97.6% |
Demographics Similar to Immigrants from Switzerland by 4th Grade
In terms of 4th grade, the demographic groups most similar to Immigrants from Switzerland are Okinawan (97.8%, a difference of 0.0%), Thai (97.8%, a difference of 0.010%), Basque (97.8%, a difference of 0.010%), Immigrants from Latvia (97.8%, a difference of 0.020%), and Iroquois (97.8%, a difference of 0.020%).
| Demographics | Rating | Rank | 4th Grade |
| Immigrants | Nonimmigrants | 97.5 /100 | #104 | Exceptional 97.9% |
| German Russians | 97.5 /100 | #105 | Exceptional 97.9% |
| Immigrants | Czechoslovakia | 97.5 /100 | #106 | Exceptional 97.9% |
| Bhutanese | 97.4 /100 | #107 | Exceptional 97.9% |
| Immigrants | Singapore | 97.3 /100 | #108 | Exceptional 97.9% |
| Immigrants | Latvia | 96.8 /100 | #109 | Exceptional 97.8% |
| Thais | 96.7 /100 | #110 | Exceptional 97.8% |
| Immigrants | Switzerland | 96.1 /100 | #111 | Exceptional 97.8% |
| Okinawans | 96.0 /100 | #112 | Exceptional 97.8% |
| Basques | 95.8 /100 | #113 | Exceptional 97.8% |
| Iroquois | 95.4 /100 | #114 | Exceptional 97.8% |
| Lebanese | 95.4 /100 | #115 | Exceptional 97.8% |
| Immigrants | Croatia | 95.2 /100 | #116 | Exceptional 97.8% |
| Syrians | 94.9 /100 | #117 | Exceptional 97.8% |
| Menominee | 94.9 /100 | #118 | Exceptional 97.8% |