British West Indian vs Polish 1st Grade
COMPARE
British West Indian
Polish
1st Grade
1st Grade Comparison
British West Indians
Poles
97.2%
1ST GRADE
0.0/ 100
METRIC RATING
292nd/ 347
METRIC RANK
98.6%
1ST GRADE
100.0/ 100
METRIC RATING
27th/ 347
METRIC RANK
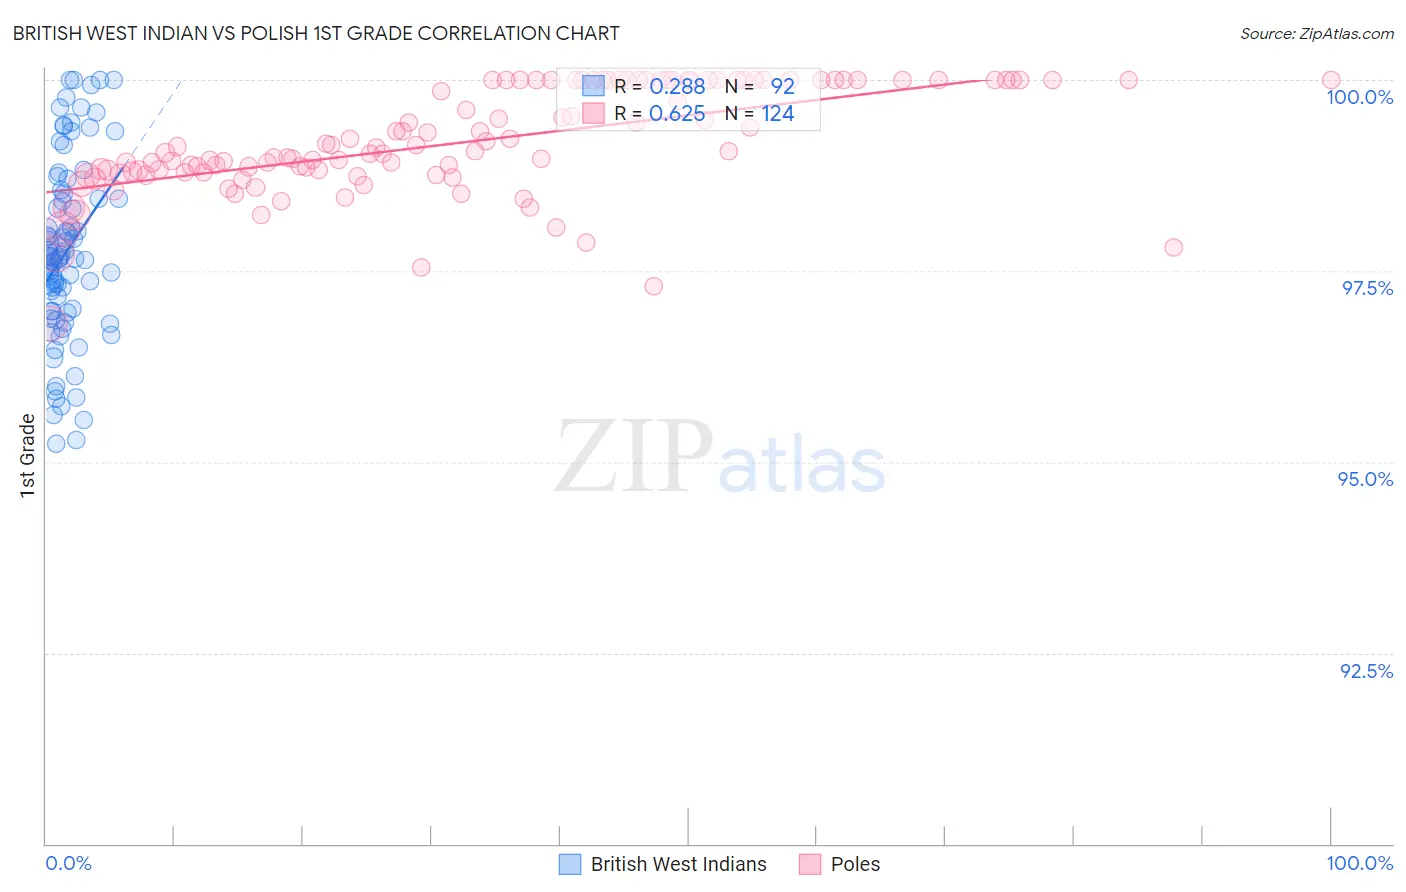
British West Indian vs Polish 1st Grade Correlation Chart
The statistical analysis conducted on geographies consisting of 152,691,173 people shows a weak positive correlation between the proportion of British West Indians and percentage of population with at least 1st grade education in the United States with a correlation coefficient (R) of 0.288 and weighted average of 97.2%. Similarly, the statistical analysis conducted on geographies consisting of 560,594,514 people shows a significant positive correlation between the proportion of Poles and percentage of population with at least 1st grade education in the United States with a correlation coefficient (R) of 0.625 and weighted average of 98.6%, a difference of 1.4%.
1st Grade Correlation Summary
| Measurement | British West Indian | Polish |
| Minimum | 95.2% | 96.8% |
| Maximum | 100.0% | 100.0% |
| Range | 4.8% | 3.2% |
| Mean | 97.8% | 99.2% |
| Median | 97.7% | 99.1% |
| Interquartile 25% (IQ1) | 97.0% | 98.8% |
| Interquartile 75% (IQ3) | 98.5% | 100.0% |
| Interquartile Range (IQR) | 1.5% | 1.2% |
| Standard Deviation (Sample) | 1.2% | 0.69% |
| Standard Deviation (Population) | 1.2% | 0.69% |
Similar Demographics by 1st Grade
Demographics Similar to British West Indians by 1st Grade
In terms of 1st grade, the demographic groups most similar to British West Indians are Houma (97.2%, a difference of 0.020%), Malaysian (97.2%, a difference of 0.020%), Immigrants from St. Vincent and the Grenadines (97.3%, a difference of 0.030%), Immigrants from Afghanistan (97.3%, a difference of 0.040%), and Immigrants from Grenada (97.2%, a difference of 0.040%).
| Demographics | Rating | Rank | 1st Grade |
| Immigrants | Portugal | 0.0 /100 | #285 | Tragic 97.3% |
| Immigrants | Barbados | 0.0 /100 | #286 | Tragic 97.3% |
| Immigrants | Hong Kong | 0.0 /100 | #287 | Tragic 97.3% |
| Immigrants | Thailand | 0.0 /100 | #288 | Tragic 97.3% |
| Immigrants | Afghanistan | 0.0 /100 | #289 | Tragic 97.3% |
| Immigrants | St. Vincent and the Grenadines | 0.0 /100 | #290 | Tragic 97.3% |
| Houma | 0.0 /100 | #291 | Tragic 97.2% |
| British West Indians | 0.0 /100 | #292 | Tragic 97.2% |
| Malaysians | 0.0 /100 | #293 | Tragic 97.2% |
| Immigrants | Grenada | 0.0 /100 | #294 | Tragic 97.2% |
| Immigrants | Immigrants | 0.0 /100 | #295 | Tragic 97.2% |
| Immigrants | Eritrea | 0.0 /100 | #296 | Tragic 97.2% |
| Central American Indians | 0.0 /100 | #297 | Tragic 97.1% |
| Immigrants | Dominica | 0.0 /100 | #298 | Tragic 97.1% |
| Immigrants | Cuba | 0.0 /100 | #299 | Tragic 97.1% |
Demographics Similar to Poles by 1st Grade
In terms of 1st grade, the demographic groups most similar to Poles are Pennsylvania German (98.6%, a difference of 0.0%), Finnish (98.6%, a difference of 0.0%), Lithuanian (98.6%, a difference of 0.0%), Danish (98.6%, a difference of 0.0%), and Scotch-Irish (98.6%, a difference of 0.0%).
| Demographics | Rating | Rank | 1st Grade |
| Sioux | 100.0 /100 | #20 | Exceptional 98.6% |
| Arapaho | 100.0 /100 | #21 | Exceptional 98.6% |
| Pennsylvania Germans | 100.0 /100 | #22 | Exceptional 98.6% |
| Finns | 100.0 /100 | #23 | Exceptional 98.6% |
| Lithuanians | 100.0 /100 | #24 | Exceptional 98.6% |
| Danes | 100.0 /100 | #25 | Exceptional 98.6% |
| Scotch-Irish | 100.0 /100 | #26 | Exceptional 98.6% |
| Poles | 100.0 /100 | #27 | Exceptional 98.6% |
| Croatians | 100.0 /100 | #28 | Exceptional 98.6% |
| French | 100.0 /100 | #29 | Exceptional 98.6% |
| Europeans | 100.0 /100 | #30 | Exceptional 98.5% |
| Czechs | 100.0 /100 | #31 | Exceptional 98.5% |
| French Canadians | 100.0 /100 | #32 | Exceptional 98.5% |
| Scandinavians | 100.0 /100 | #33 | Exceptional 98.5% |
| Swiss | 100.0 /100 | #34 | Exceptional 98.5% |