Mongolian vs Immigrants from Nepal 1st Grade
COMPARE
Mongolian
Immigrants from Nepal
1st Grade
1st Grade Comparison
Mongolians
Immigrants from Nepal
97.9%
1ST GRADE
29.2/ 100
METRIC RATING
194th/ 347
METRIC RANK
97.7%
1ST GRADE
4.0/ 100
METRIC RATING
225th/ 347
METRIC RANK
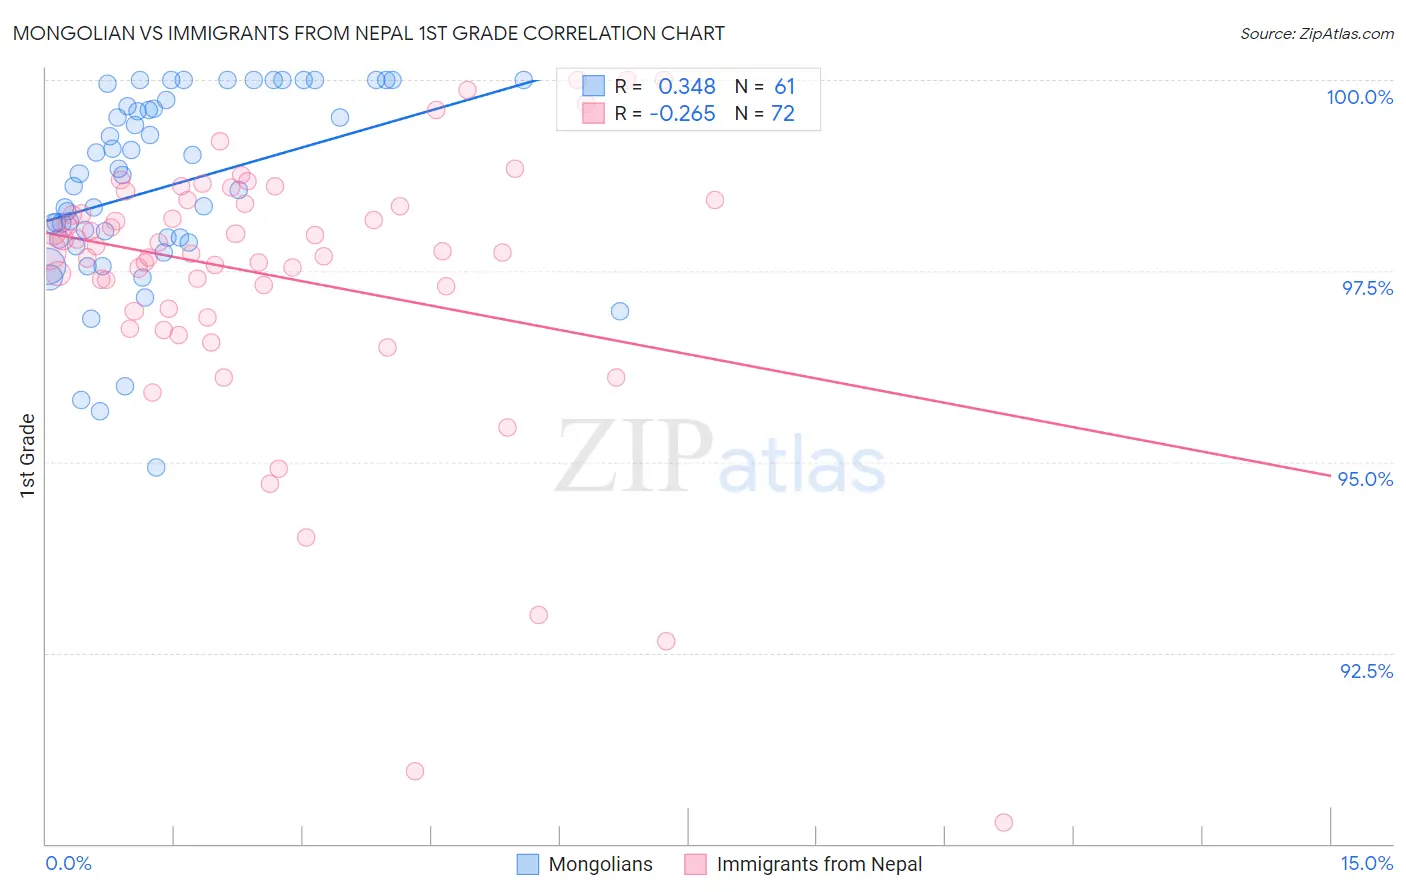
Mongolian vs Immigrants from Nepal 1st Grade Correlation Chart
The statistical analysis conducted on geographies consisting of 140,362,004 people shows a mild positive correlation between the proportion of Mongolians and percentage of population with at least 1st grade education in the United States with a correlation coefficient (R) of 0.348 and weighted average of 97.9%. Similarly, the statistical analysis conducted on geographies consisting of 186,766,254 people shows a weak negative correlation between the proportion of Immigrants from Nepal and percentage of population with at least 1st grade education in the United States with a correlation coefficient (R) of -0.265 and weighted average of 97.7%, a difference of 0.18%.
1st Grade Correlation Summary
| Measurement | Mongolian | Immigrants from Nepal |
| Minimum | 94.9% | 90.3% |
| Maximum | 100.0% | 100.0% |
| Range | 5.1% | 9.7% |
| Mean | 98.6% | 97.4% |
| Median | 98.8% | 97.8% |
| Interquartile 25% (IQ1) | 97.9% | 97.0% |
| Interquartile 75% (IQ3) | 99.7% | 98.4% |
| Interquartile Range (IQR) | 1.8% | 1.4% |
| Standard Deviation (Sample) | 1.2% | 1.8% |
| Standard Deviation (Population) | 1.2% | 1.8% |
Similar Demographics by 1st Grade
Demographics Similar to Mongolians by 1st Grade
In terms of 1st grade, the demographic groups most similar to Mongolians are Paraguayan (97.9%, a difference of 0.0%), Immigrants from Taiwan (97.9%, a difference of 0.0%), Hawaiian (97.9%, a difference of 0.0%), Black/African American (97.9%, a difference of 0.010%), and Immigrants from Kenya (97.8%, a difference of 0.010%).
| Demographics | Rating | Rank | 1st Grade |
| Pakistanis | 35.8 /100 | #187 | Fair 97.9% |
| Arabs | 35.5 /100 | #188 | Fair 97.9% |
| Immigrants | Kazakhstan | 34.9 /100 | #189 | Fair 97.9% |
| Panamanians | 34.1 /100 | #190 | Fair 97.9% |
| Blacks/African Americans | 30.7 /100 | #191 | Fair 97.9% |
| Paraguayans | 30.2 /100 | #192 | Fair 97.9% |
| Immigrants | Taiwan | 29.4 /100 | #193 | Fair 97.9% |
| Mongolians | 29.2 /100 | #194 | Fair 97.9% |
| Hawaiians | 28.8 /100 | #195 | Fair 97.9% |
| Immigrants | Kenya | 26.3 /100 | #196 | Fair 97.8% |
| Guamanians/Chamorros | 26.2 /100 | #197 | Fair 97.8% |
| Yuman | 24.4 /100 | #198 | Fair 97.8% |
| Tohono O'odham | 23.2 /100 | #199 | Fair 97.8% |
| Immigrants | Egypt | 22.6 /100 | #200 | Fair 97.8% |
| Immigrants | Lebanon | 20.1 /100 | #201 | Fair 97.8% |
Demographics Similar to Immigrants from Nepal by 1st Grade
In terms of 1st grade, the demographic groups most similar to Immigrants from Nepal are Immigrants from Syria (97.7%, a difference of 0.0%), Immigrants from Zaire (97.7%, a difference of 0.0%), Iraqi (97.7%, a difference of 0.0%), Sudanese (97.7%, a difference of 0.0%), and Tongan (97.7%, a difference of 0.010%).
| Demographics | Rating | Rank | 1st Grade |
| Immigrants | Morocco | 5.3 /100 | #218 | Tragic 97.7% |
| Immigrants | Panama | 5.2 /100 | #219 | Tragic 97.7% |
| Tongans | 4.6 /100 | #220 | Tragic 97.7% |
| Immigrants | Sudan | 4.3 /100 | #221 | Tragic 97.7% |
| Immigrants | Syria | 4.2 /100 | #222 | Tragic 97.7% |
| Immigrants | Zaire | 4.1 /100 | #223 | Tragic 97.7% |
| Iraqis | 4.0 /100 | #224 | Tragic 97.7% |
| Immigrants | Nepal | 4.0 /100 | #225 | Tragic 97.7% |
| Sudanese | 3.7 /100 | #226 | Tragic 97.7% |
| Sierra Leoneans | 3.6 /100 | #227 | Tragic 97.7% |
| Sub-Saharan Africans | 3.6 /100 | #228 | Tragic 97.7% |
| Immigrants | Costa Rica | 3.5 /100 | #229 | Tragic 97.7% |
| Senegalese | 3.5 /100 | #230 | Tragic 97.7% |
| Puerto Ricans | 3.0 /100 | #231 | Tragic 97.7% |
| Immigrants | Uruguay | 2.5 /100 | #232 | Tragic 97.6% |