Mongolian vs Immigrants from Switzerland Unemployment Among Seniors over 65 years
COMPARE
Mongolian
Immigrants from Switzerland
Unemployment Among Seniors over 65 years
Unemployment Among Seniors over 65 years Comparison
Mongolians
Immigrants from Switzerland
5.1%
UNEMPLOYMENT AMONG SENIORS OVER 65 YEARS
59.8/ 100
METRIC RATING
168th/ 347
METRIC RANK
5.0%
UNEMPLOYMENT AMONG SENIORS OVER 65 YEARS
98.2/ 100
METRIC RATING
87th/ 347
METRIC RANK
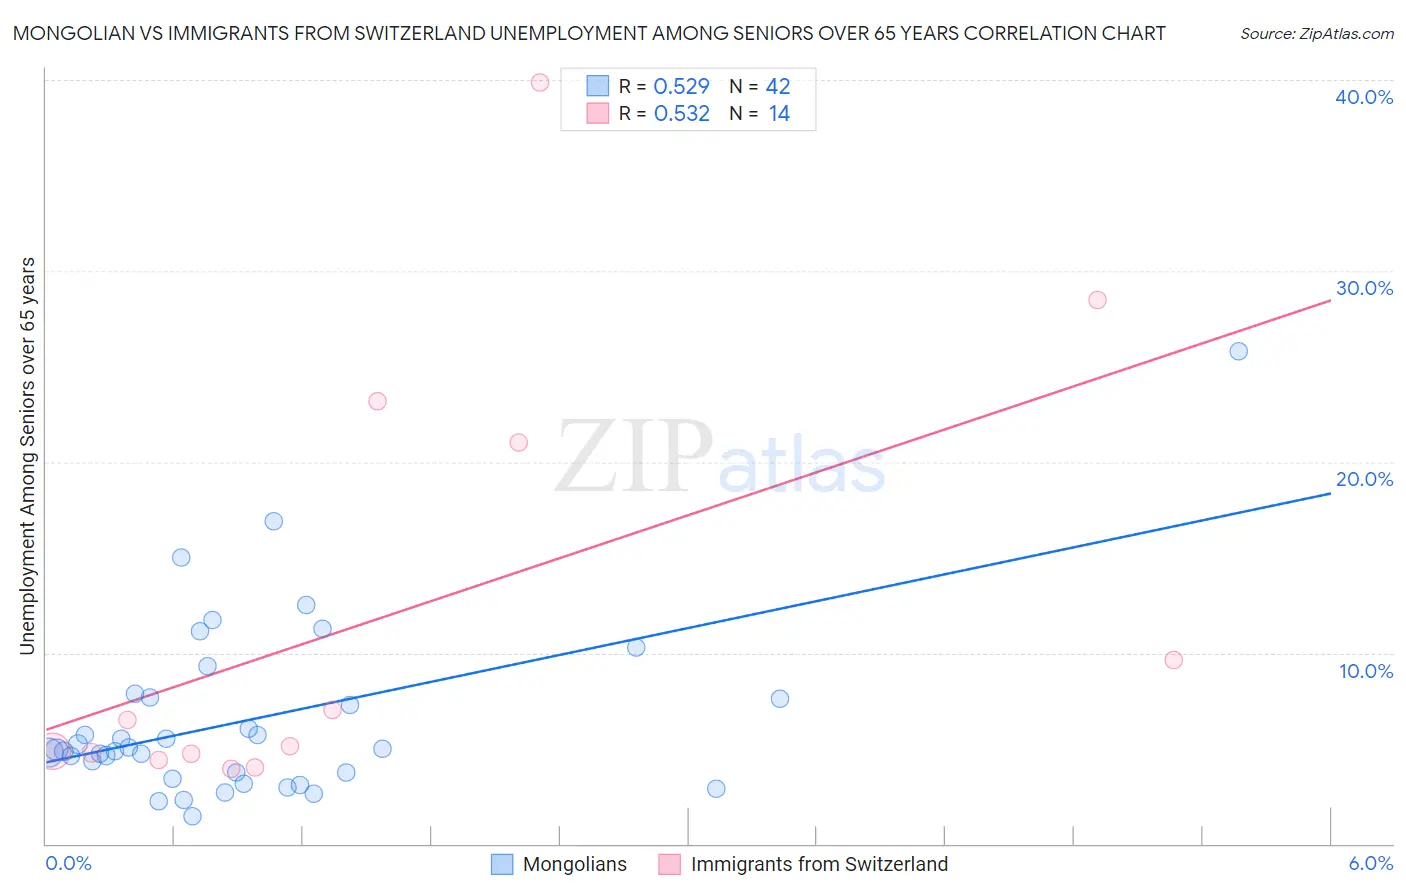
Mongolian vs Immigrants from Switzerland Unemployment Among Seniors over 65 years Correlation Chart
The statistical analysis conducted on geographies consisting of 135,223,533 people shows a substantial positive correlation between the proportion of Mongolians and unemployment rate amomg seniors over the age of 65 in the United States with a correlation coefficient (R) of 0.529 and weighted average of 5.1%. Similarly, the statistical analysis conducted on geographies consisting of 141,778,502 people shows a substantial positive correlation between the proportion of Immigrants from Switzerland and unemployment rate amomg seniors over the age of 65 in the United States with a correlation coefficient (R) of 0.532 and weighted average of 5.0%, a difference of 3.0%.
Unemployment Among Seniors over 65 years Correlation Summary
| Measurement | Mongolian | Immigrants from Switzerland |
| Minimum | 1.4% | 3.9% |
| Maximum | 25.8% | 39.9% |
| Range | 24.4% | 36.0% |
| Mean | 6.5% | 12.0% |
| Median | 5.0% | 5.8% |
| Interquartile 25% (IQ1) | 3.7% | 4.7% |
| Interquartile 75% (IQ3) | 7.7% | 21.0% |
| Interquartile Range (IQR) | 4.0% | 16.3% |
| Standard Deviation (Sample) | 4.7% | 11.5% |
| Standard Deviation (Population) | 4.6% | 11.1% |
Similar Demographics by Unemployment Among Seniors over 65 years
Demographics Similar to Mongolians by Unemployment Among Seniors over 65 years
In terms of unemployment among seniors over 65 years, the demographic groups most similar to Mongolians are Immigrants from Western Europe (5.1%, a difference of 0.020%), Lithuanian (5.1%, a difference of 0.050%), Immigrants from Laos (5.1%, a difference of 0.14%), Immigrants from Ukraine (5.1%, a difference of 0.15%), and Potawatomi (5.1%, a difference of 0.16%).
| Demographics | Rating | Rank | Unemployment Among Seniors over 65 years |
| Immigrants | Bosnia and Herzegovina | 66.1 /100 | #161 | Good 5.1% |
| Immigrants | South Eastern Asia | 65.6 /100 | #162 | Good 5.1% |
| Potawatomi | 64.5 /100 | #163 | Good 5.1% |
| Nepalese | 64.5 /100 | #164 | Good 5.1% |
| Immigrants | Ukraine | 64.2 /100 | #165 | Good 5.1% |
| Immigrants | Laos | 63.8 /100 | #166 | Good 5.1% |
| Immigrants | Western Europe | 60.4 /100 | #167 | Good 5.1% |
| Mongolians | 59.8 /100 | #168 | Average 5.1% |
| Lithuanians | 58.2 /100 | #169 | Average 5.1% |
| Immigrants | Eastern Asia | 54.9 /100 | #170 | Average 5.1% |
| Immigrants | Nonimmigrants | 54.1 /100 | #171 | Average 5.1% |
| Immigrants | Ireland | 53.2 /100 | #172 | Average 5.1% |
| Immigrants | Spain | 51.7 /100 | #173 | Average 5.1% |
| Spanish Americans | 50.0 /100 | #174 | Average 5.1% |
| Immigrants | Eastern Europe | 49.8 /100 | #175 | Average 5.1% |
Demographics Similar to Immigrants from Switzerland by Unemployment Among Seniors over 65 years
In terms of unemployment among seniors over 65 years, the demographic groups most similar to Immigrants from Switzerland are Immigrants from Hungary (5.0%, a difference of 0.010%), Immigrants from Taiwan (5.0%, a difference of 0.010%), Filipino (5.0%, a difference of 0.070%), Immigrants from Zimbabwe (5.0%, a difference of 0.080%), and Serbian (5.0%, a difference of 0.12%).
| Demographics | Rating | Rank | Unemployment Among Seniors over 65 years |
| Immigrants | Ethiopia | 98.6 /100 | #80 | Exceptional 5.0% |
| Estonians | 98.5 /100 | #81 | Exceptional 5.0% |
| Serbians | 98.4 /100 | #82 | Exceptional 5.0% |
| Immigrants | Zimbabwe | 98.3 /100 | #83 | Exceptional 5.0% |
| Filipinos | 98.3 /100 | #84 | Exceptional 5.0% |
| Immigrants | Hungary | 98.2 /100 | #85 | Exceptional 5.0% |
| Immigrants | Taiwan | 98.2 /100 | #86 | Exceptional 5.0% |
| Immigrants | Switzerland | 98.2 /100 | #87 | Exceptional 5.0% |
| Afghans | 97.6 /100 | #88 | Exceptional 5.0% |
| Immigrants | South Central Asia | 97.6 /100 | #89 | Exceptional 5.0% |
| Immigrants | South Africa | 97.6 /100 | #90 | Exceptional 5.0% |
| Immigrants | Bolivia | 97.3 /100 | #91 | Exceptional 5.0% |
| Immigrants | Bulgaria | 97.3 /100 | #92 | Exceptional 5.0% |
| Austrians | 97.3 /100 | #93 | Exceptional 5.0% |
| Burmese | 96.8 /100 | #94 | Exceptional 5.0% |