Mexican vs Immigrants from Zaire 3rd Grade
COMPARE
Mexican
Immigrants from Zaire
3rd Grade
3rd Grade Comparison
Mexicans
Immigrants from Zaire
96.2%
3RD GRADE
0.0/ 100
METRIC RATING
332nd/ 347
METRIC RANK
97.6%
3RD GRADE
11.9/ 100
METRIC RATING
208th/ 347
METRIC RANK
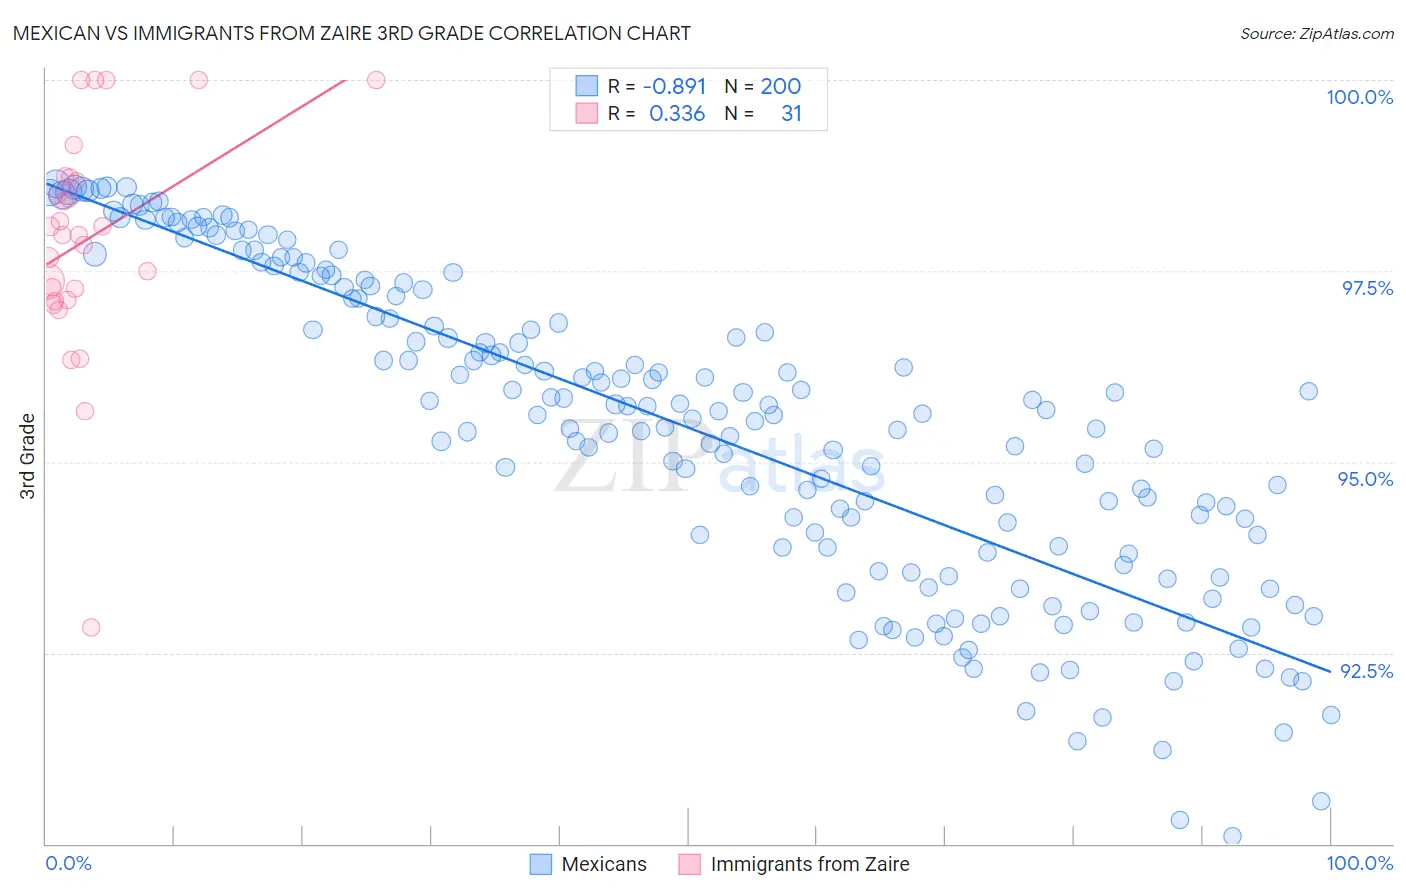
Mexican vs Immigrants from Zaire 3rd Grade Correlation Chart
The statistical analysis conducted on geographies consisting of 565,340,458 people shows a very strong negative correlation between the proportion of Mexicans and percentage of population with at least 3rd grade education in the United States with a correlation coefficient (R) of -0.891 and weighted average of 96.2%. Similarly, the statistical analysis conducted on geographies consisting of 107,212,695 people shows a mild positive correlation between the proportion of Immigrants from Zaire and percentage of population with at least 3rd grade education in the United States with a correlation coefficient (R) of 0.336 and weighted average of 97.6%, a difference of 1.4%.
3rd Grade Correlation Summary
| Measurement | Mexican | Immigrants from Zaire |
| Minimum | 90.1% | 92.8% |
| Maximum | 98.6% | 100.0% |
| Range | 8.5% | 7.2% |
| Mean | 95.4% | 97.9% |
| Median | 95.7% | 98.0% |
| Interquartile 25% (IQ1) | 93.8% | 97.1% |
| Interquartile 75% (IQ3) | 97.3% | 98.7% |
| Interquartile Range (IQR) | 3.4% | 1.6% |
| Standard Deviation (Sample) | 2.1% | 1.5% |
| Standard Deviation (Population) | 2.1% | 1.5% |
Similar Demographics by 3rd Grade
Demographics Similar to Mexicans by 3rd Grade
In terms of 3rd grade, the demographic groups most similar to Mexicans are Immigrants from Latin America (96.2%, a difference of 0.010%), Immigrants from Armenia (96.3%, a difference of 0.020%), Immigrants from Fiji (96.2%, a difference of 0.030%), Immigrants from Cambodia (96.2%, a difference of 0.050%), and Immigrants from Dominican Republic (96.2%, a difference of 0.050%).
| Demographics | Rating | Rank | 3rd Grade |
| Mexican American Indians | 0.0 /100 | #325 | Tragic 96.4% |
| Immigrants | Vietnam | 0.0 /100 | #326 | Tragic 96.4% |
| Japanese | 0.0 /100 | #327 | Tragic 96.4% |
| Bangladeshis | 0.0 /100 | #328 | Tragic 96.3% |
| Immigrants | Honduras | 0.0 /100 | #329 | Tragic 96.3% |
| Immigrants | Armenia | 0.0 /100 | #330 | Tragic 96.3% |
| Immigrants | Latin America | 0.0 /100 | #331 | Tragic 96.2% |
| Mexicans | 0.0 /100 | #332 | Tragic 96.2% |
| Immigrants | Fiji | 0.0 /100 | #333 | Tragic 96.2% |
| Immigrants | Cambodia | 0.0 /100 | #334 | Tragic 96.2% |
| Immigrants | Dominican Republic | 0.0 /100 | #335 | Tragic 96.2% |
| Immigrants | Cabo Verde | 0.0 /100 | #336 | Tragic 96.2% |
| Central Americans | 0.0 /100 | #337 | Tragic 96.1% |
| Guatemalans | 0.0 /100 | #338 | Tragic 96.0% |
| Yakama | 0.0 /100 | #339 | Tragic 95.9% |
Demographics Similar to Immigrants from Zaire by 3rd Grade
In terms of 3rd grade, the demographic groups most similar to Immigrants from Zaire are Tohono O'odham (97.6%, a difference of 0.0%), Immigrants from Northern Africa (97.6%, a difference of 0.010%), African (97.6%, a difference of 0.020%), Costa Rican (97.6%, a difference of 0.020%), and Immigrants from Oceania (97.6%, a difference of 0.020%).
| Demographics | Rating | Rank | 3rd Grade |
| Immigrants | Lebanon | 21.7 /100 | #201 | Fair 97.7% |
| Immigrants | Southern Europe | 17.7 /100 | #202 | Poor 97.6% |
| Paiute | 16.7 /100 | #203 | Poor 97.6% |
| Immigrants | Chile | 16.5 /100 | #204 | Poor 97.6% |
| Africans | 14.5 /100 | #205 | Poor 97.6% |
| Immigrants | Northern Africa | 13.0 /100 | #206 | Poor 97.6% |
| Tohono O'odham | 12.5 /100 | #207 | Poor 97.6% |
| Immigrants | Zaire | 11.9 /100 | #208 | Poor 97.6% |
| Costa Ricans | 9.6 /100 | #209 | Tragic 97.6% |
| Immigrants | Oceania | 9.5 /100 | #210 | Tragic 97.6% |
| Laotians | 9.4 /100 | #211 | Tragic 97.6% |
| Immigrants | Bahamas | 8.5 /100 | #212 | Tragic 97.6% |
| Moroccans | 8.5 /100 | #213 | Tragic 97.6% |
| Yuman | 8.4 /100 | #214 | Tragic 97.6% |
| Iraqis | 6.9 /100 | #215 | Tragic 97.5% |