Mexican vs Immigrants from Liberia 3rd Grade
COMPARE
Mexican
Immigrants from Liberia
3rd Grade
3rd Grade Comparison
Mexicans
Immigrants from Liberia
96.2%
3RD GRADE
0.0/ 100
METRIC RATING
332nd/ 347
METRIC RANK
97.3%
3RD GRADE
0.5/ 100
METRIC RATING
258th/ 347
METRIC RANK
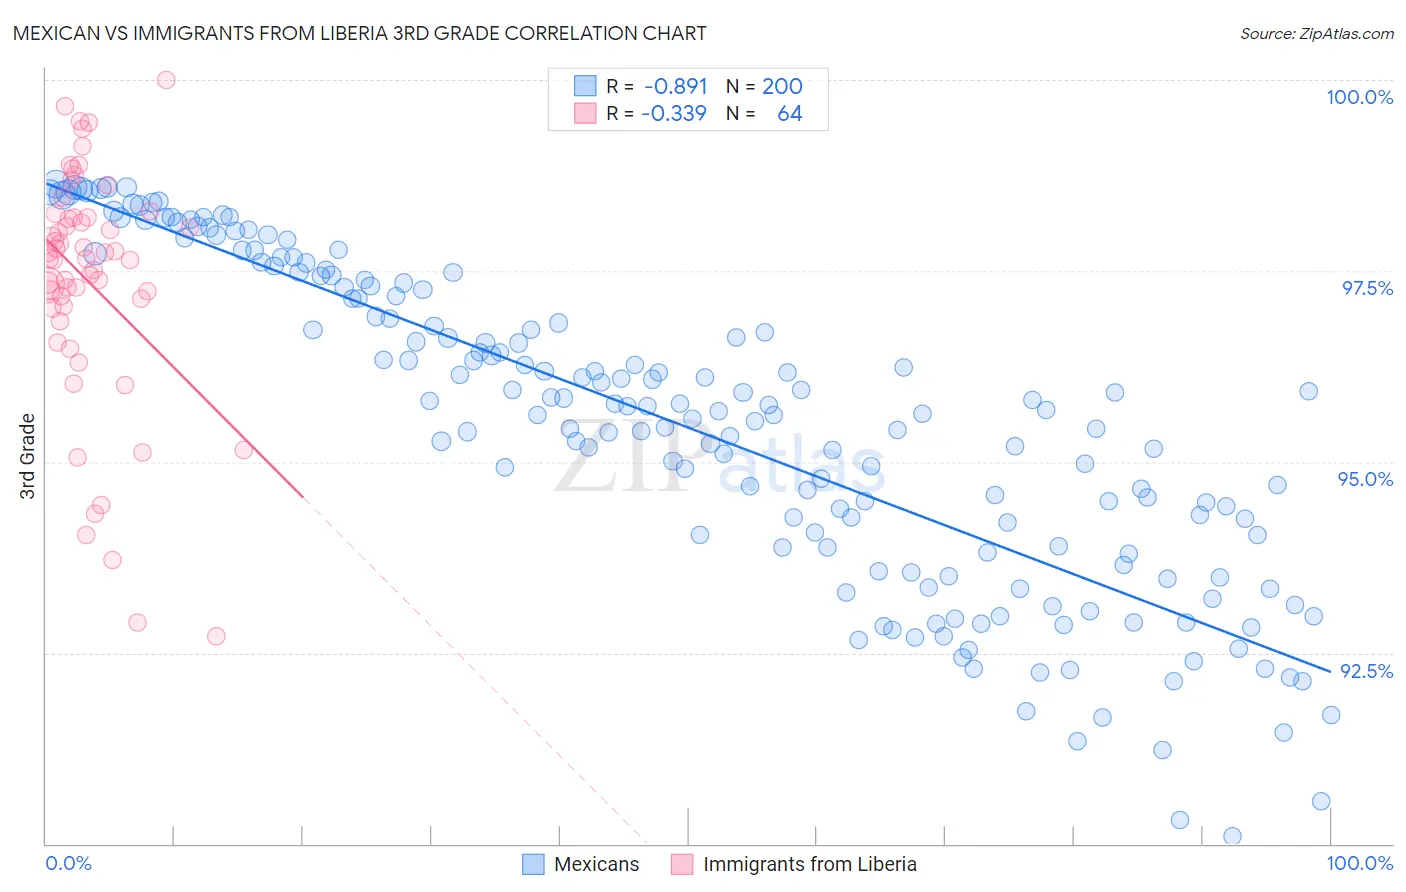
Mexican vs Immigrants from Liberia 3rd Grade Correlation Chart
The statistical analysis conducted on geographies consisting of 565,340,458 people shows a very strong negative correlation between the proportion of Mexicans and percentage of population with at least 3rd grade education in the United States with a correlation coefficient (R) of -0.891 and weighted average of 96.2%. Similarly, the statistical analysis conducted on geographies consisting of 135,294,272 people shows a mild negative correlation between the proportion of Immigrants from Liberia and percentage of population with at least 3rd grade education in the United States with a correlation coefficient (R) of -0.339 and weighted average of 97.3%, a difference of 1.1%.
3rd Grade Correlation Summary
| Measurement | Mexican | Immigrants from Liberia |
| Minimum | 90.1% | 92.7% |
| Maximum | 98.6% | 100.0% |
| Range | 8.5% | 7.3% |
| Mean | 95.4% | 97.3% |
| Median | 95.7% | 97.7% |
| Interquartile 25% (IQ1) | 93.8% | 97.0% |
| Interquartile 75% (IQ3) | 97.3% | 98.2% |
| Interquartile Range (IQR) | 3.4% | 1.2% |
| Standard Deviation (Sample) | 2.1% | 1.6% |
| Standard Deviation (Population) | 2.1% | 1.6% |
Similar Demographics by 3rd Grade
Demographics Similar to Mexicans by 3rd Grade
In terms of 3rd grade, the demographic groups most similar to Mexicans are Immigrants from Latin America (96.2%, a difference of 0.010%), Immigrants from Armenia (96.3%, a difference of 0.020%), Immigrants from Fiji (96.2%, a difference of 0.030%), Immigrants from Cambodia (96.2%, a difference of 0.050%), and Immigrants from Dominican Republic (96.2%, a difference of 0.050%).
| Demographics | Rating | Rank | 3rd Grade |
| Mexican American Indians | 0.0 /100 | #325 | Tragic 96.4% |
| Immigrants | Vietnam | 0.0 /100 | #326 | Tragic 96.4% |
| Japanese | 0.0 /100 | #327 | Tragic 96.4% |
| Bangladeshis | 0.0 /100 | #328 | Tragic 96.3% |
| Immigrants | Honduras | 0.0 /100 | #329 | Tragic 96.3% |
| Immigrants | Armenia | 0.0 /100 | #330 | Tragic 96.3% |
| Immigrants | Latin America | 0.0 /100 | #331 | Tragic 96.2% |
| Mexicans | 0.0 /100 | #332 | Tragic 96.2% |
| Immigrants | Fiji | 0.0 /100 | #333 | Tragic 96.2% |
| Immigrants | Cambodia | 0.0 /100 | #334 | Tragic 96.2% |
| Immigrants | Dominican Republic | 0.0 /100 | #335 | Tragic 96.2% |
| Immigrants | Cabo Verde | 0.0 /100 | #336 | Tragic 96.2% |
| Central Americans | 0.0 /100 | #337 | Tragic 96.1% |
| Guatemalans | 0.0 /100 | #338 | Tragic 96.0% |
| Yakama | 0.0 /100 | #339 | Tragic 95.9% |
Demographics Similar to Immigrants from Liberia by 3rd Grade
In terms of 3rd grade, the demographic groups most similar to Immigrants from Liberia are Immigrants from Colombia (97.3%, a difference of 0.010%), Armenian (97.3%, a difference of 0.010%), Immigrants from Ethiopia (97.3%, a difference of 0.010%), Bolivian (97.3%, a difference of 0.020%), and Immigrants from Congo (97.3%, a difference of 0.020%).
| Demographics | Rating | Rank | 3rd Grade |
| Immigrants | Asia | 0.8 /100 | #251 | Tragic 97.4% |
| Peruvians | 0.8 /100 | #252 | Tragic 97.4% |
| Immigrants | Africa | 0.8 /100 | #253 | Tragic 97.4% |
| Jamaicans | 0.7 /100 | #254 | Tragic 97.4% |
| Bolivians | 0.6 /100 | #255 | Tragic 97.3% |
| Immigrants | Congo | 0.6 /100 | #256 | Tragic 97.3% |
| Immigrants | Colombia | 0.5 /100 | #257 | Tragic 97.3% |
| Immigrants | Liberia | 0.5 /100 | #258 | Tragic 97.3% |
| Armenians | 0.4 /100 | #259 | Tragic 97.3% |
| Immigrants | Ethiopia | 0.4 /100 | #260 | Tragic 97.3% |
| Immigrants | South America | 0.4 /100 | #261 | Tragic 97.3% |
| Immigrants | Sierra Leone | 0.4 /100 | #262 | Tragic 97.3% |
| Taiwanese | 0.3 /100 | #263 | Tragic 97.3% |
| West Indians | 0.3 /100 | #264 | Tragic 97.3% |
| Immigrants | Jamaica | 0.3 /100 | #265 | Tragic 97.3% |