Mexican vs Hopi 3rd Grade
COMPARE
Mexican
Hopi
3rd Grade
3rd Grade Comparison
Mexicans
Hopi
96.2%
3RD GRADE
0.0/ 100
METRIC RATING
332nd/ 347
METRIC RANK
98.1%
3RD GRADE
98.7/ 100
METRIC RATING
91st/ 347
METRIC RANK
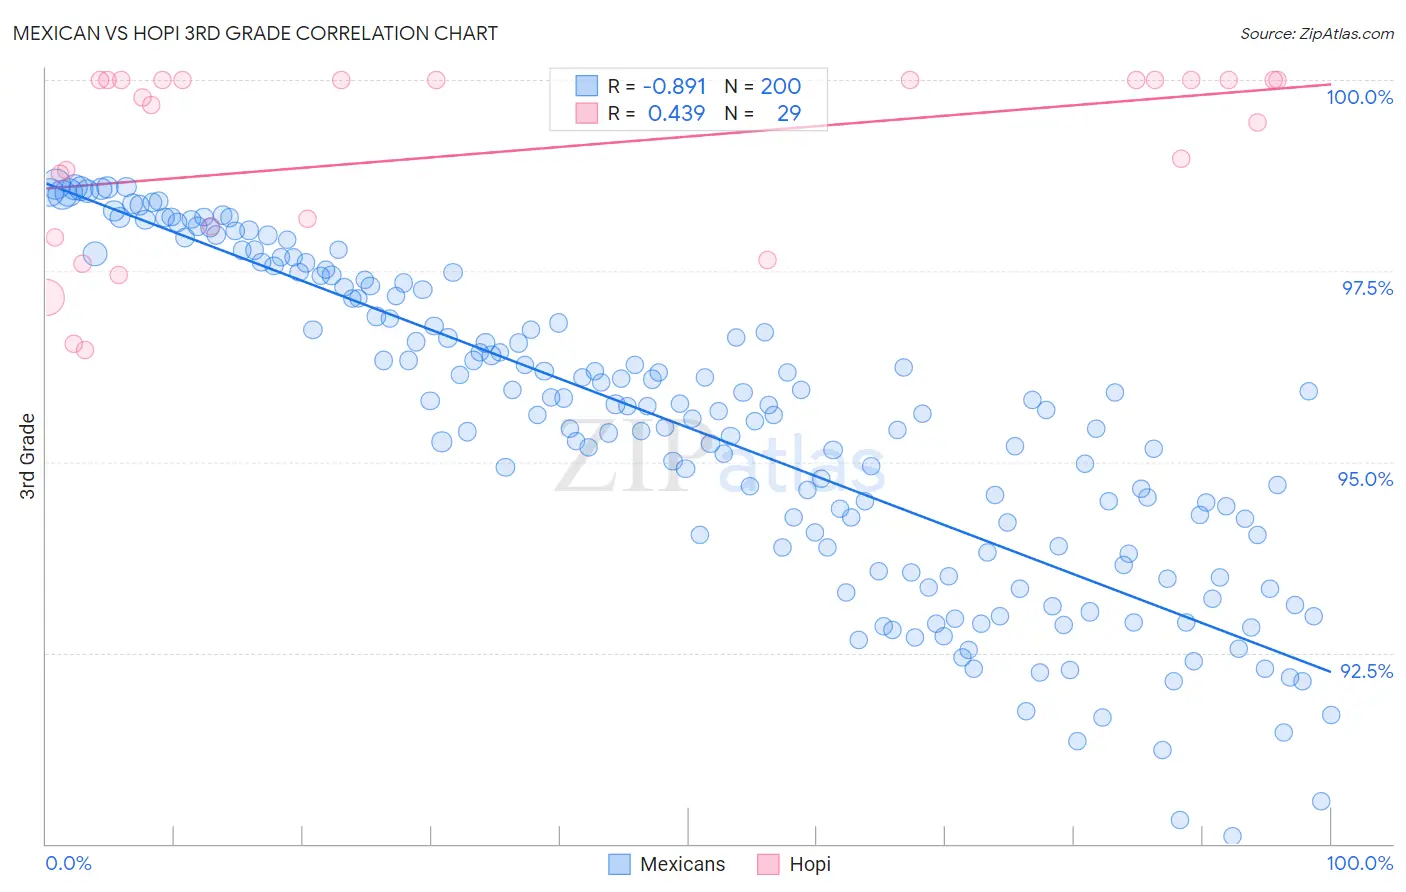
Mexican vs Hopi 3rd Grade Correlation Chart
The statistical analysis conducted on geographies consisting of 565,340,458 people shows a very strong negative correlation between the proportion of Mexicans and percentage of population with at least 3rd grade education in the United States with a correlation coefficient (R) of -0.891 and weighted average of 96.2%. Similarly, the statistical analysis conducted on geographies consisting of 74,739,957 people shows a moderate positive correlation between the proportion of Hopi and percentage of population with at least 3rd grade education in the United States with a correlation coefficient (R) of 0.439 and weighted average of 98.1%, a difference of 2.0%.
3rd Grade Correlation Summary
| Measurement | Mexican | Hopi |
| Minimum | 90.1% | 96.5% |
| Maximum | 98.6% | 100.0% |
| Range | 8.5% | 3.5% |
| Mean | 95.4% | 99.1% |
| Median | 95.7% | 99.8% |
| Interquartile 25% (IQ1) | 93.8% | 98.0% |
| Interquartile 75% (IQ3) | 97.3% | 100.0% |
| Interquartile Range (IQR) | 3.4% | 2.0% |
| Standard Deviation (Sample) | 2.1% | 1.2% |
| Standard Deviation (Population) | 2.1% | 1.2% |
Similar Demographics by 3rd Grade
Demographics Similar to Mexicans by 3rd Grade
In terms of 3rd grade, the demographic groups most similar to Mexicans are Immigrants from Latin America (96.2%, a difference of 0.010%), Immigrants from Armenia (96.3%, a difference of 0.020%), Immigrants from Fiji (96.2%, a difference of 0.030%), Immigrants from Cambodia (96.2%, a difference of 0.050%), and Immigrants from Dominican Republic (96.2%, a difference of 0.050%).
| Demographics | Rating | Rank | 3rd Grade |
| Mexican American Indians | 0.0 /100 | #325 | Tragic 96.4% |
| Immigrants | Vietnam | 0.0 /100 | #326 | Tragic 96.4% |
| Japanese | 0.0 /100 | #327 | Tragic 96.4% |
| Bangladeshis | 0.0 /100 | #328 | Tragic 96.3% |
| Immigrants | Honduras | 0.0 /100 | #329 | Tragic 96.3% |
| Immigrants | Armenia | 0.0 /100 | #330 | Tragic 96.3% |
| Immigrants | Latin America | 0.0 /100 | #331 | Tragic 96.2% |
| Mexicans | 0.0 /100 | #332 | Tragic 96.2% |
| Immigrants | Fiji | 0.0 /100 | #333 | Tragic 96.2% |
| Immigrants | Cambodia | 0.0 /100 | #334 | Tragic 96.2% |
| Immigrants | Dominican Republic | 0.0 /100 | #335 | Tragic 96.2% |
| Immigrants | Cabo Verde | 0.0 /100 | #336 | Tragic 96.2% |
| Central Americans | 0.0 /100 | #337 | Tragic 96.1% |
| Guatemalans | 0.0 /100 | #338 | Tragic 96.0% |
| Yakama | 0.0 /100 | #339 | Tragic 95.9% |
Demographics Similar to Hopi by 3rd Grade
In terms of 3rd grade, the demographic groups most similar to Hopi are Zimbabwean (98.1%, a difference of 0.0%), Immigrants from South Africa (98.1%, a difference of 0.0%), Immigrants from Western Europe (98.1%, a difference of 0.0%), Immigrants from Sweden (98.1%, a difference of 0.010%), and Immigrants from Australia (98.1%, a difference of 0.010%).
| Demographics | Rating | Rank | 3rd Grade |
| Immigrants | Sweden | 98.9 /100 | #84 | Exceptional 98.1% |
| Immigrants | Australia | 98.9 /100 | #85 | Exceptional 98.1% |
| Potawatomi | 98.9 /100 | #86 | Exceptional 98.1% |
| Immigrants | Denmark | 98.8 /100 | #87 | Exceptional 98.1% |
| Immigrants | India | 98.8 /100 | #88 | Exceptional 98.1% |
| Delaware | 98.8 /100 | #89 | Exceptional 98.1% |
| Zimbabweans | 98.8 /100 | #90 | Exceptional 98.1% |
| Hopi | 98.7 /100 | #91 | Exceptional 98.1% |
| Immigrants | South Africa | 98.7 /100 | #92 | Exceptional 98.1% |
| Immigrants | Western Europe | 98.7 /100 | #93 | Exceptional 98.1% |
| Immigrants | Germany | 98.4 /100 | #94 | Exceptional 98.1% |
| Cypriots | 98.4 /100 | #95 | Exceptional 98.1% |
| Immigrants | Ireland | 98.2 /100 | #96 | Exceptional 98.1% |
| South Africans | 98.2 /100 | #97 | Exceptional 98.1% |
| Choctaw | 98.0 /100 | #98 | Exceptional 98.1% |