Immigrants from Bangladesh vs Immigrants from Zaire 3rd Grade

COMPARE

Immigrants from Bangladesh
Race
Ancestry
AfghanAfricanAlaska NativeAlaskan AthabascanAlbanianAleutAlsatianAmericanApacheArabArapahoArgentineanArmenianAssyrian/Chaldean/SyriacAustralianAustrianBahamianBangladeshiBarbadianBasqueBelgianBelizeanBermudanBhutaneseBlackfeetBolivianBrazilianBritishBritish West IndianBulgarianBurmeseCajunCambodianCanadianCape VerdeanCarpatho RusynCelticCentral AmericanCentral American IndianCherokeeCheyenneChickasawChileanChineseChippewaChoctawColombianColvilleComancheCosta RicanCreeCreekCroatianCrowCubanCypriotCzechCzechoslovakianDanishDelawareDominicanDutchDutch West IndianEastern EuropeanEcuadorianEgyptianEnglishEstonianEthiopianEuropeanFijianFilipinoFinnishFrenchFrench American IndianFrench CanadianGermanGerman RussianGhanaianGreekGuamanian/ChamorroGuatemalanGuyaneseHaitianHmongHonduranHopiHoumaHungarianIcelanderIndian (Asian)IndonesianInupiatIranianIraqiIrishIroquoisIsraeliItalianJamaicanJapaneseJordanianKenyanKiowaKoreanLaotianLatvianLebaneseLiberianLithuanianLumbeeLuxembourgerMacedonianMalaysianMalteseMarshalleseMenomineeMexicanMexican American IndianMongolianMoroccanNative HawaiianNavajoNepaleseNew ZealanderNicaraguanNigerianNorthern EuropeanNorwegianOkinawanOsageOttawaPaiutePakistaniPalestinianPanamanianParaguayanPennsylvania GermanPeruvianPimaPolishPortuguesePotawatomiPuebloPuerto RicanPuget Sound SalishRomanianRussianSalvadoranSamoanScandinavianScotch-IrishScottishSeminoleSenegaleseSerbianShoshoneSierra LeoneanSiouxSlavicSlovakSloveneSomaliSouth AfricanSouth AmericanSouth American IndianSoviet UnionSpaniardSpanishSpanish AmericanSpanish American IndianSri LankanSubsaharan AfricanSudaneseSwedishSwissSyrianTaiwaneseThaiTlingit-HaidaTohono O'OdhamTonganTrinidadian and TobagonianTsimshianTurkishU.S. Virgin IslanderUgandanUkrainianUruguayanUteVenezuelanVietnameseWelshWest IndianYakamaYaquiYugoslavianYumanYup'ikZimbabwean
Immigration
NonimmigrantsImmigrantsAfghanistanAfricaAlbaniaArgentinaArmeniaAsiaAustraliaAustriaBahamasBangladeshBarbadosBelarusBelgiumBelizeBoliviaBosnia and HerzegovinaBrazilBulgariaBurma/MyanmarCabo VerdeCambodiaCameroonCanadaCaribbeanCentral AmericaChileChinaColombiaCongoCosta RicaCroatiaCubaCzechoslovakiaDenmarkDominicaDominican RepublicEastern AfricaEastern AsiaEastern EuropeEcuadorEgyptEl SalvadorEnglandEritreaEthiopiaEuropeFijiFranceGermanyGhanaGreeceGrenadaGuatemalaGuyanaHaitiHondurasHong KongHungaryIndiaIndonesiaIranIraqIrelandIsraelItalyJamaicaJapanJordanKazakhstanKenyaKoreaKuwaitLaosLatin AmericaLatviaLebanonLiberiaLithuaniaMalaysiaMexicoMicronesiaMiddle AfricaMoldovaMoroccoNepalNetherlandsNicaraguaNigeriaNorth AmericaNorth MacedoniaNorthern AfricaNorthern EuropeNorwayOceaniaPakistanPanamaPeruPhilippinesPolandPortugalRomaniaRussiaSaudi ArabiaScotlandSenegalSerbiaSierra LeoneSingaporeSomaliaSouth AfricaSouth AmericaSouth Central AsiaSouth Eastern AsiaSouthern EuropeSpainSri LankaSt. Vincent and the GrenadinesSudanSwedenSwitzerlandSyriaTaiwanThailandTrinidad and TobagoTurkeyUgandaUkraineUruguayUzbekistanVenezuelaVietnamWest IndiesWestern AfricaWestern AsiaWestern EuropeYemenZimbabweAzores
Immigrants from Zaire
Race
Ancestry
AfghanAfricanAlaska NativeAlaskan AthabascanAlbanianAleutAlsatianAmericanApacheArabArapahoArgentineanArmenianAssyrian/Chaldean/SyriacAustralianAustrianBahamianBangladeshiBarbadianBasqueBelgianBelizeanBermudanBhutaneseBlackfeetBolivianBrazilianBritishBritish West IndianBulgarianBurmeseCajunCambodianCanadianCape VerdeanCarpatho RusynCelticCentral AmericanCentral American IndianCherokeeCheyenneChickasawChileanChineseChippewaChoctawColombianColvilleComancheCosta RicanCreeCreekCroatianCrowCubanCypriotCzechCzechoslovakianDanishDelawareDominicanDutchDutch West IndianEastern EuropeanEcuadorianEgyptianEnglishEstonianEthiopianEuropeanFijianFilipinoFinnishFrenchFrench American IndianFrench CanadianGermanGerman RussianGhanaianGreekGuamanian/ChamorroGuatemalanGuyaneseHaitianHmongHonduranHopiHoumaHungarianIcelanderIndian (Asian)IndonesianInupiatIranianIraqiIrishIroquoisIsraeliItalianJamaicanJapaneseJordanianKenyanKiowaKoreanLaotianLatvianLebaneseLiberianLithuanianLumbeeLuxembourgerMacedonianMalaysianMalteseMarshalleseMenomineeMexicanMexican American IndianMongolianMoroccanNative HawaiianNavajoNepaleseNew ZealanderNicaraguanNigerianNorthern EuropeanNorwegianOkinawanOsageOttawaPaiutePakistaniPalestinianPanamanianParaguayanPennsylvania GermanPeruvianPimaPolishPortuguesePotawatomiPuebloPuerto RicanPuget Sound SalishRomanianRussianSalvadoranSamoanScandinavianScotch-IrishScottishSeminoleSenegaleseSerbianShoshoneSierra LeoneanSiouxSlavicSlovakSloveneSomaliSouth AfricanSouth AmericanSouth American IndianSoviet UnionSpaniardSpanishSpanish AmericanSpanish American IndianSri LankanSubsaharan AfricanSudaneseSwedishSwissSyrianTaiwaneseThaiTlingit-HaidaTohono O'OdhamTonganTrinidadian and TobagonianTsimshianTurkishU.S. Virgin IslanderUgandanUkrainianUruguayanUteVenezuelanVietnameseWelshWest IndianYakamaYaquiYugoslavianYumanYup'ikZimbabwean
Immigration
NonimmigrantsImmigrantsAfghanistanAfricaAlbaniaArgentinaArmeniaAsiaAustraliaAustriaBahamasBarbadosBelarusBelgiumBelizeBoliviaBosnia and HerzegovinaBrazilBulgariaBurma/MyanmarCabo VerdeCambodiaCameroonCanadaCaribbeanCentral AmericaChileChinaColombiaCongoCosta RicaCroatiaCubaCzechoslovakiaDenmarkDominicaDominican RepublicEastern AfricaEastern AsiaEastern EuropeEcuadorEgyptEl SalvadorEnglandEritreaEthiopiaEuropeFijiFranceGermanyGhanaGreeceGrenadaGuatemalaGuyanaHaitiHondurasHong KongHungaryIndiaIndonesiaIranIraqIrelandIsraelItalyJamaicaJapanJordanKazakhstanKenyaKoreaKuwaitLaosLatin AmericaLatviaLebanonLiberiaLithuaniaMalaysiaMexicoMicronesiaMiddle AfricaMoldovaMoroccoNepalNetherlandsNicaraguaNigeriaNorth AmericaNorth MacedoniaNorthern AfricaNorthern EuropeNorwayOceaniaPakistanPanamaPeruPhilippinesPolandPortugalRomaniaRussiaSaudi ArabiaScotlandSenegalSerbiaSierra LeoneSingaporeSomaliaSouth AfricaSouth AmericaSouth Central AsiaSouth Eastern AsiaSouthern EuropeSpainSri LankaSt. Vincent and the GrenadinesSudanSwedenSwitzerlandSyriaTaiwanThailandTrinidad and TobagoTurkeyUgandaUkraineUruguayUzbekistanVenezuelaVietnamWest IndiesWestern AfricaWestern AsiaWestern EuropeYemenZaireZimbabweAzores
3rd Grade
Income
Poverty
Unemployment
Labor Participation
Family Structure
Vehicle Availability
Education Level
Disability

3rd Grade Comparison

Immigrants from Bangladesh

Immigrants from Zaire

Tragic
Poor
96.6%
3RD GRADE
0.0/ 100
METRIC RATING
317th/ 347
METRIC RANK
97.6%
3RD GRADE
11.9/ 100
METRIC RATING
208th/ 347
METRIC RANK

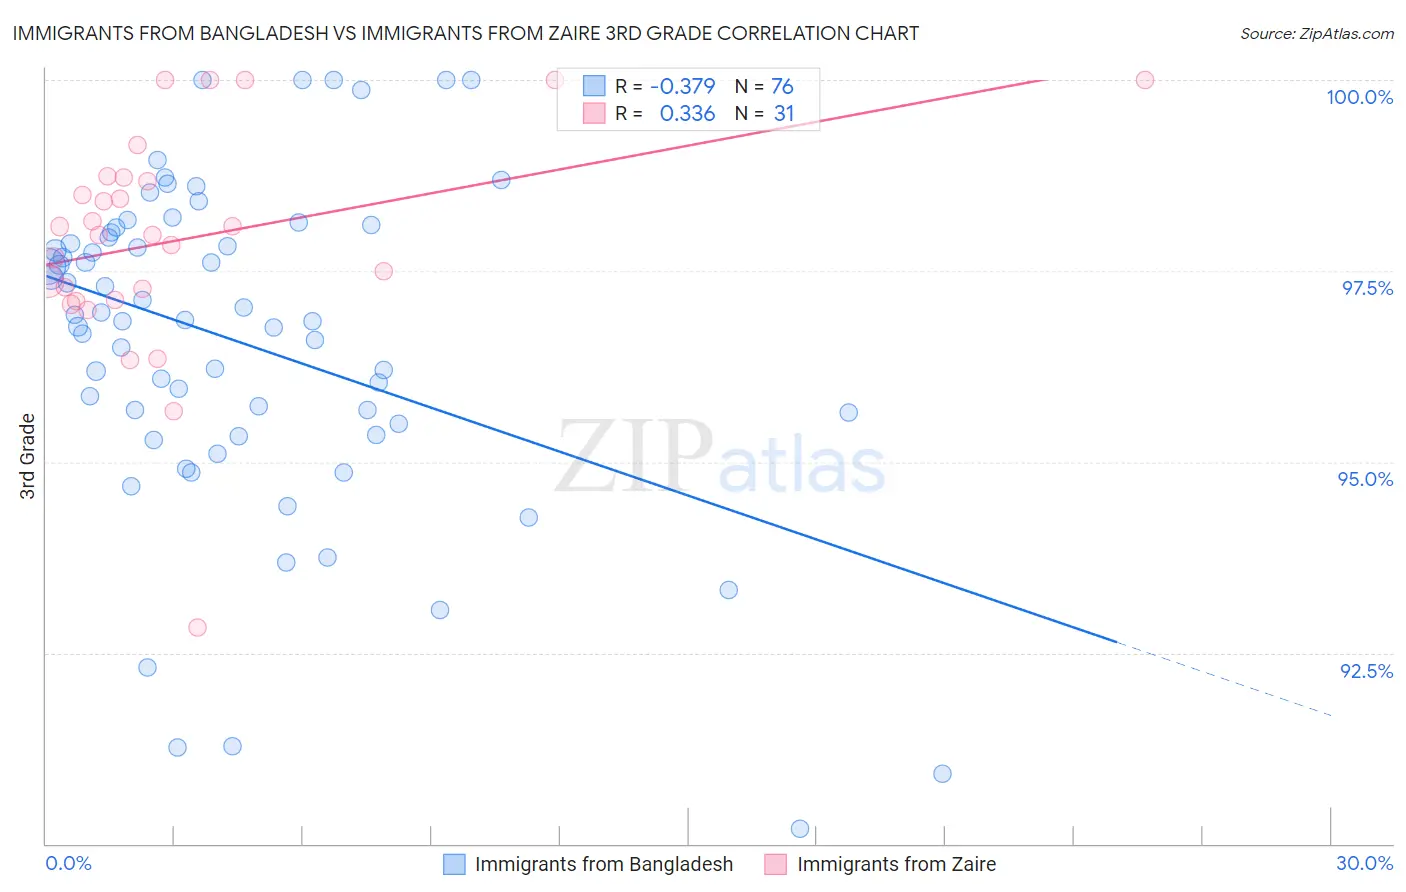
Immigrants from Bangladesh vs Immigrants from Zaire 3rd Grade Correlation Chart

The statistical analysis conducted on geographies consisting of 203,681,254 people shows a mild negative correlation between the proportion of Immigrants from Bangladesh and percentage of population with at least 3rd grade education in the United States with a correlation coefficient (R) of -0.379 and weighted average of 96.6%. Similarly, the statistical analysis conducted on geographies consisting of 107,212,695 people shows a mild positive correlation between the proportion of Immigrants from Zaire and percentage of population with at least 3rd grade education in the United States with a correlation coefficient (R) of 0.336 and weighted average of 97.6%, a difference of 1.1%.
Immigrants from Bangladesh vs Immigrants from Zaire 3rd Grade

3rd Grade Correlation Summary

MeasurementImmigrants from BangladeshImmigrants from Zaire
Minimum90.2%92.8%
Maximum100.0%100.0%
Range9.8%7.2%
Mean96.5%97.9%
Median96.9%98.0%
Interquartile 25% (IQ1)95.4%97.1%
Interquartile 75% (IQ3)98.0%98.7%
Interquartile Range (IQR)2.5%1.6%
Standard Deviation (Sample)2.2%1.5%
Standard Deviation (Population)2.2%1.5%

Similar Demographics by 3rd Grade

Demographics Similar to Immigrants from Bangladesh by 3rd Grade

In terms of 3rd grade, the demographic groups most similar to Immigrants from Bangladesh are Immigrants from Burma/Myanmar (96.6%, a difference of 0.020%), Hispanic or Latino (96.5%, a difference of 0.020%), Immigrants from the Azores (96.6%, a difference of 0.030%), Immigrants from Ecuador (96.6%, a difference of 0.040%), and Belizean (96.6%, a difference of 0.040%).
DemographicsRating | Rank3rd Grade
Cape Verdeans
0.0
/100
|
#310
Tragic
96.6%
Immigrants | Guyana
0.0
/100
|
#311
Tragic
96.6%
Immigrants | Laos
0.0
/100
|
#312
Tragic
96.6%
Immigrants | Ecuador
0.0
/100
|
#313
Tragic
96.6%
Belizeans
0.0
/100
|
#314
Tragic
96.6%
Immigrants | Azores
0.0
/100
|
#315
Tragic
96.6%
Immigrants | Burma/Myanmar
0.0
/100
|
#316
Tragic
96.6%
Immigrants | Bangladesh
0.0
/100
|
#317
Tragic
96.6%
Hispanics or Latinos
0.0
/100
|
#318
Tragic
96.5%
Vietnamese
0.0
/100
|
#319
Tragic
96.5%
Immigrants | Nicaragua
0.0
/100
|
#320
Tragic
96.5%
Indonesians
0.0
/100
|
#321
Tragic
96.5%
Immigrants | Belize
0.0
/100
|
#322
Tragic
96.5%
Hondurans
0.0
/100
|
#323
Tragic
96.5%
Dominicans
0.0
/100
|
#324
Tragic
96.4%

Demographics Similar to Immigrants from Zaire by 3rd Grade

In terms of 3rd grade, the demographic groups most similar to Immigrants from Zaire are Tohono O'odham (97.6%, a difference of 0.0%), Immigrants from Northern Africa (97.6%, a difference of 0.010%), African (97.6%, a difference of 0.020%), Costa Rican (97.6%, a difference of 0.020%), and Immigrants from Oceania (97.6%, a difference of 0.020%).
DemographicsRating | Rank3rd Grade
Immigrants | Lebanon
21.7
/100
|
#201
Fair
97.7%
Immigrants | Southern Europe
17.7
/100
|
#202
Poor
97.6%
Paiute
16.7
/100
|
#203
Poor
97.6%
Immigrants | Chile
16.5
/100
|
#204
Poor
97.6%
Africans
14.5
/100
|
#205
Poor
97.6%
Immigrants | Northern Africa
13.0
/100
|
#206
Poor
97.6%
Tohono O'odham
12.5
/100
|
#207
Poor
97.6%
Immigrants | Zaire
11.9
/100
|
#208
Poor
97.6%
Costa Ricans
9.6
/100
|
#209
Tragic
97.6%
Immigrants | Oceania
9.5
/100
|
#210
Tragic
97.6%
Laotians
9.4
/100
|
#211
Tragic
97.6%
Immigrants | Bahamas
8.5
/100
|
#212
Tragic
97.6%
Moroccans
8.5
/100
|
#213
Tragic
97.6%
Yuman
8.4
/100
|
#214
Tragic
97.6%
Iraqis
6.9
/100
|
#215
Tragic
97.5%