Mexican vs Immigrants from Oceania GED/Equivalency
COMPARE
Mexican
Immigrants from Oceania
GED/Equivalency
GED/Equivalency Comparison
Mexicans
Immigrants from Oceania
77.4%
GED/EQUIVALENCY
0.0/ 100
METRIC RATING
341st/ 347
METRIC RANK
85.5%
GED/EQUIVALENCY
33.6/ 100
METRIC RATING
184th/ 347
METRIC RANK
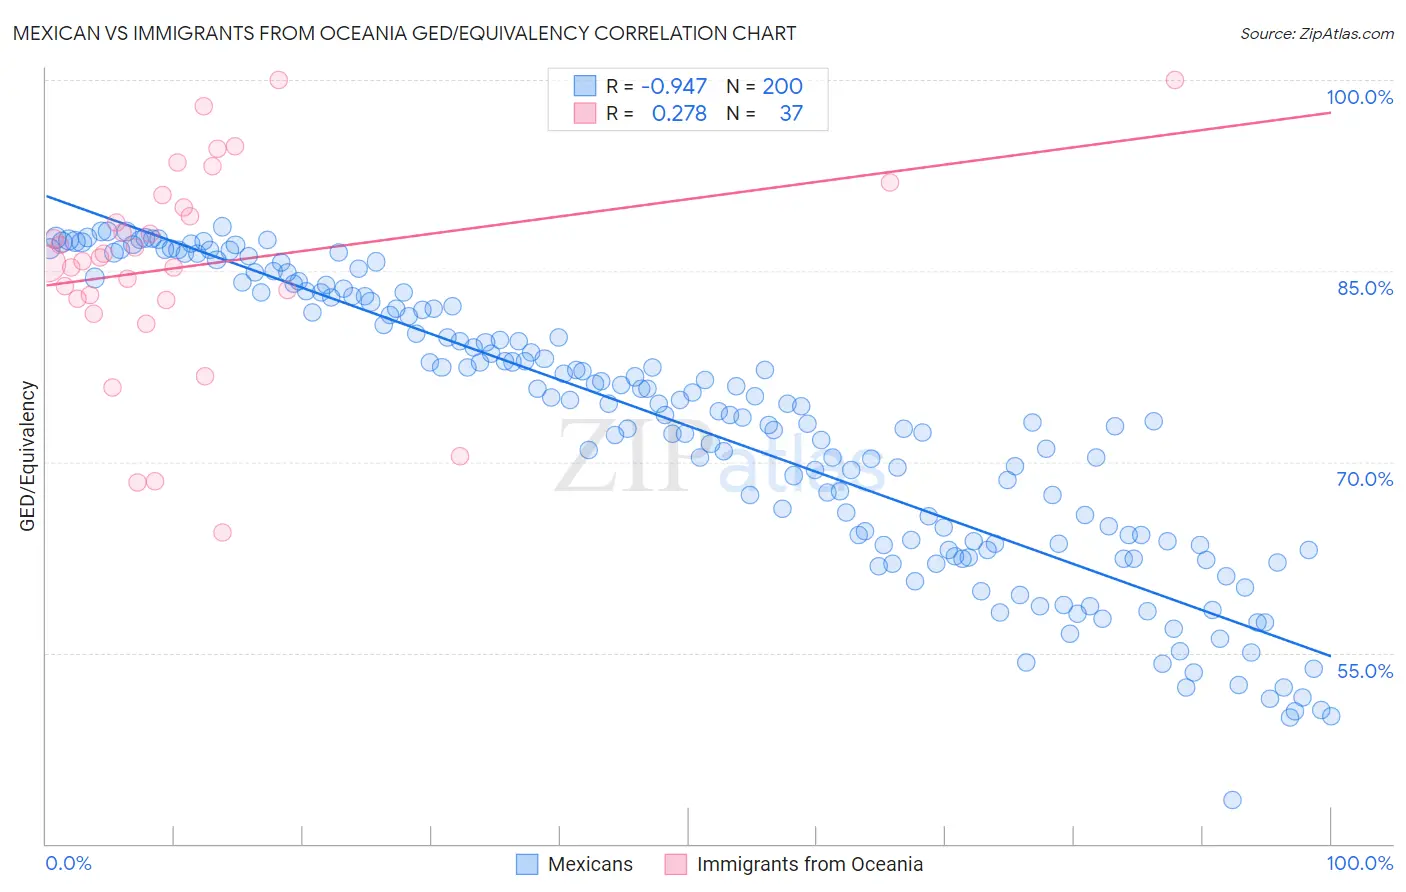
Mexican vs Immigrants from Oceania GED/Equivalency Correlation Chart
The statistical analysis conducted on geographies consisting of 565,337,088 people shows a near-perfect negative correlation between the proportion of Mexicans and percentage of population with at least ged/equivalency education in the United States with a correlation coefficient (R) of -0.947 and weighted average of 77.4%. Similarly, the statistical analysis conducted on geographies consisting of 305,521,521 people shows a weak positive correlation between the proportion of Immigrants from Oceania and percentage of population with at least ged/equivalency education in the United States with a correlation coefficient (R) of 0.278 and weighted average of 85.5%, a difference of 10.3%.
GED/Equivalency Correlation Summary
| Measurement | Mexican | Immigrants from Oceania |
| Minimum | 43.4% | 64.5% |
| Maximum | 88.5% | 100.0% |
| Range | 45.1% | 35.5% |
| Mean | 72.8% | 85.5% |
| Median | 74.5% | 86.1% |
| Interquartile 25% (IQ1) | 63.6% | 82.8% |
| Interquartile 75% (IQ3) | 83.0% | 90.5% |
| Interquartile Range (IQR) | 19.4% | 7.7% |
| Standard Deviation (Sample) | 11.1% | 8.3% |
| Standard Deviation (Population) | 11.0% | 8.2% |
Similar Demographics by GED/Equivalency
Demographics Similar to Mexicans by GED/Equivalency
In terms of ged/equivalency, the demographic groups most similar to Mexicans are Tohono O'odham (77.5%, a difference of 0.090%), Immigrants from El Salvador (77.6%, a difference of 0.24%), Immigrants from Guatemala (77.9%, a difference of 0.63%), Immigrants from Yemen (77.9%, a difference of 0.65%), and Immigrants from Dominican Republic (78.0%, a difference of 0.71%).
| Demographics | Rating | Rank | GED/Equivalency |
| Salvadorans | 0.0 /100 | #333 | Tragic 78.6% |
| Guatemalans | 0.0 /100 | #334 | Tragic 78.5% |
| Immigrants | Latin America | 0.0 /100 | #335 | Tragic 78.5% |
| Immigrants | Dominican Republic | 0.0 /100 | #336 | Tragic 78.0% |
| Immigrants | Yemen | 0.0 /100 | #337 | Tragic 77.9% |
| Immigrants | Guatemala | 0.0 /100 | #338 | Tragic 77.9% |
| Immigrants | El Salvador | 0.0 /100 | #339 | Tragic 77.6% |
| Tohono O'odham | 0.0 /100 | #340 | Tragic 77.5% |
| Mexicans | 0.0 /100 | #341 | Tragic 77.4% |
| Pima | 0.0 /100 | #342 | Tragic 76.4% |
| Immigrants | Central America | 0.0 /100 | #343 | Tragic 76.4% |
| Spanish American Indians | 0.0 /100 | #344 | Tragic 76.3% |
| Immigrants | Mexico | 0.0 /100 | #345 | Tragic 75.7% |
| Houma | 0.0 /100 | #346 | Tragic 75.0% |
| Yakama | 0.0 /100 | #347 | Tragic 74.5% |
Demographics Similar to Immigrants from Oceania by GED/Equivalency
In terms of ged/equivalency, the demographic groups most similar to Immigrants from Oceania are Immigrants from Sudan (85.5%, a difference of 0.010%), Spanish (85.4%, a difference of 0.020%), Sudanese (85.5%, a difference of 0.040%), Spaniard (85.4%, a difference of 0.040%), and Moroccan (85.5%, a difference of 0.090%).
| Demographics | Rating | Rank | GED/Equivalency |
| Immigrants | Uganda | 45.2 /100 | #177 | Average 85.7% |
| Koreans | 41.2 /100 | #178 | Average 85.6% |
| Aleuts | 40.5 /100 | #179 | Average 85.6% |
| Immigrants | Southern Europe | 38.4 /100 | #180 | Fair 85.5% |
| Moroccans | 37.7 /100 | #181 | Fair 85.5% |
| Sudanese | 35.2 /100 | #182 | Fair 85.5% |
| Immigrants | Sudan | 34.2 /100 | #183 | Fair 85.5% |
| Immigrants | Oceania | 33.6 /100 | #184 | Fair 85.5% |
| Spanish | 32.8 /100 | #185 | Fair 85.4% |
| Spaniards | 31.9 /100 | #186 | Fair 85.4% |
| Immigrants | Afghanistan | 29.8 /100 | #187 | Fair 85.4% |
| Immigrants | Sierra Leone | 29.0 /100 | #188 | Fair 85.4% |
| Guamanians/Chamorros | 28.4 /100 | #189 | Fair 85.3% |
| Alaskan Athabascans | 27.5 /100 | #190 | Fair 85.3% |
| South American Indians | 22.8 /100 | #191 | Fair 85.2% |