Portuguese vs Hopi 3rd Grade
COMPARE
Portuguese
Hopi
3rd Grade
3rd Grade Comparison
Portuguese
Hopi
97.7%
3RD GRADE
36.2/ 100
METRIC RATING
186th/ 347
METRIC RANK
98.1%
3RD GRADE
98.7/ 100
METRIC RATING
91st/ 347
METRIC RANK
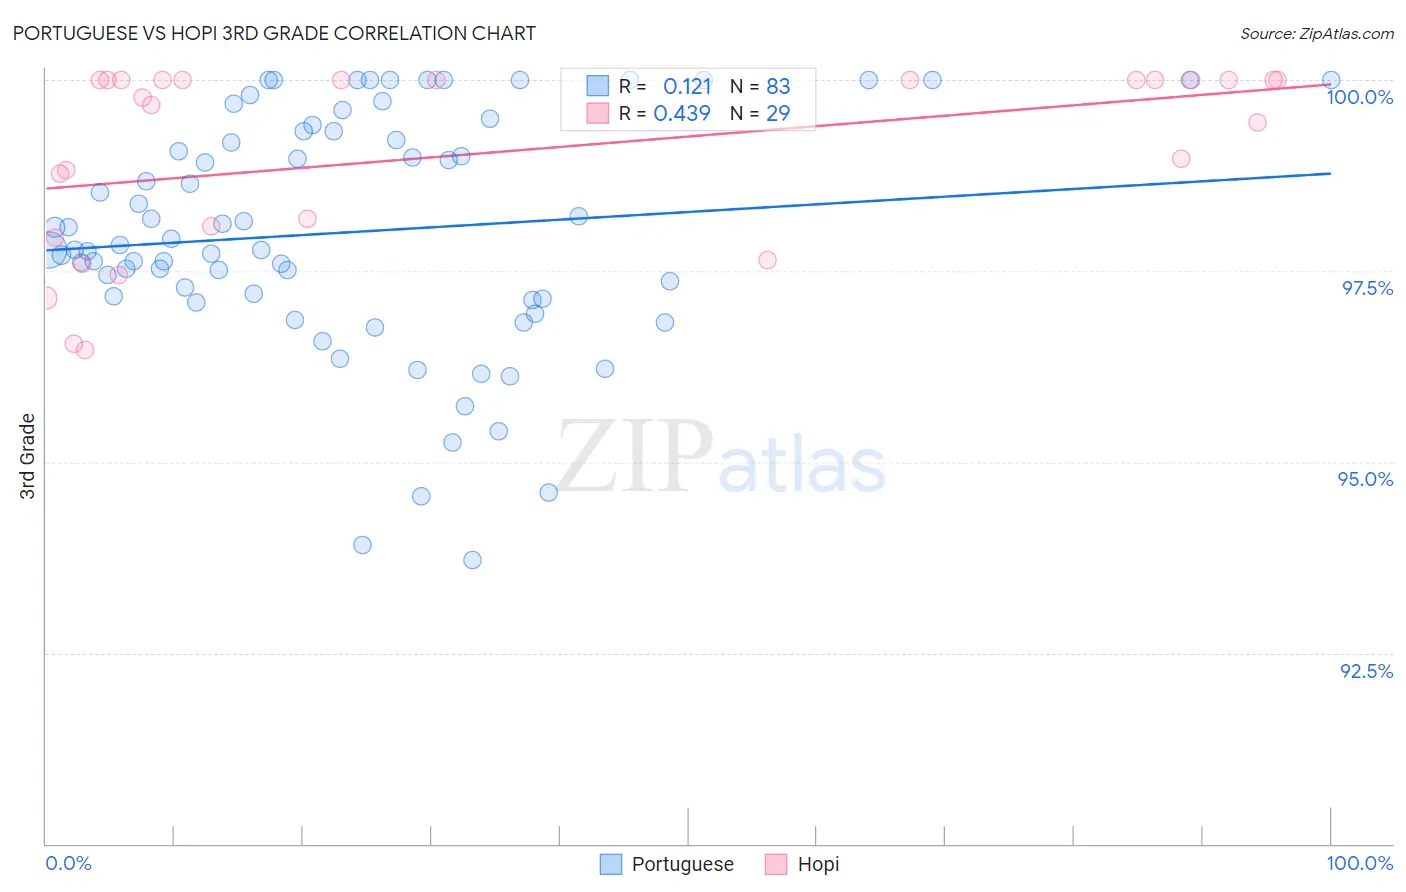
Portuguese vs Hopi 3rd Grade Correlation Chart
The statistical analysis conducted on geographies consisting of 450,368,110 people shows a poor positive correlation between the proportion of Portuguese and percentage of population with at least 3rd grade education in the United States with a correlation coefficient (R) of 0.121 and weighted average of 97.7%. Similarly, the statistical analysis conducted on geographies consisting of 74,739,957 people shows a moderate positive correlation between the proportion of Hopi and percentage of population with at least 3rd grade education in the United States with a correlation coefficient (R) of 0.439 and weighted average of 98.1%, a difference of 0.42%.
3rd Grade Correlation Summary
| Measurement | Portuguese | Hopi |
| Minimum | 93.7% | 96.5% |
| Maximum | 100.0% | 100.0% |
| Range | 6.3% | 3.5% |
| Mean | 98.0% | 99.1% |
| Median | 97.8% | 99.8% |
| Interquartile 25% (IQ1) | 97.1% | 98.0% |
| Interquartile 75% (IQ3) | 99.3% | 100.0% |
| Interquartile Range (IQR) | 2.2% | 2.0% |
| Standard Deviation (Sample) | 1.5% | 1.2% |
| Standard Deviation (Population) | 1.5% | 1.2% |
Similar Demographics by 3rd Grade
Demographics Similar to Portuguese by 3rd Grade
In terms of 3rd grade, the demographic groups most similar to Portuguese are Immigrants from Kazakhstan (97.7%, a difference of 0.0%), Immigrants from Argentina (97.7%, a difference of 0.0%), Native/Alaskan (97.7%, a difference of 0.0%), Arab (97.7%, a difference of 0.010%), and Immigrants from Taiwan (97.7%, a difference of 0.010%).
| Demographics | Rating | Rank | 3rd Grade |
| Immigrants | Belarus | 45.9 /100 | #179 | Average 97.7% |
| Immigrants | Sri Lanka | 45.1 /100 | #180 | Average 97.7% |
| Immigrants | Venezuela | 44.4 /100 | #181 | Average 97.7% |
| Argentineans | 42.9 /100 | #182 | Average 97.7% |
| Arabs | 40.0 /100 | #183 | Fair 97.7% |
| Immigrants | Kazakhstan | 37.4 /100 | #184 | Fair 97.7% |
| Immigrants | Argentina | 37.0 /100 | #185 | Fair 97.7% |
| Portuguese | 36.2 /100 | #186 | Fair 97.7% |
| Natives/Alaskans | 35.2 /100 | #187 | Fair 97.7% |
| Immigrants | Taiwan | 34.2 /100 | #188 | Fair 97.7% |
| Pakistanis | 34.2 /100 | #189 | Fair 97.7% |
| Panamanians | 31.5 /100 | #190 | Fair 97.7% |
| Blacks/African Americans | 29.6 /100 | #191 | Fair 97.7% |
| Mongolians | 29.1 /100 | #192 | Fair 97.7% |
| Immigrants | Kenya | 28.2 /100 | #193 | Fair 97.7% |
Demographics Similar to Hopi by 3rd Grade
In terms of 3rd grade, the demographic groups most similar to Hopi are Zimbabwean (98.1%, a difference of 0.0%), Immigrants from South Africa (98.1%, a difference of 0.0%), Immigrants from Western Europe (98.1%, a difference of 0.0%), Immigrants from Sweden (98.1%, a difference of 0.010%), and Immigrants from Australia (98.1%, a difference of 0.010%).
| Demographics | Rating | Rank | 3rd Grade |
| Immigrants | Sweden | 98.9 /100 | #84 | Exceptional 98.1% |
| Immigrants | Australia | 98.9 /100 | #85 | Exceptional 98.1% |
| Potawatomi | 98.9 /100 | #86 | Exceptional 98.1% |
| Immigrants | Denmark | 98.8 /100 | #87 | Exceptional 98.1% |
| Immigrants | India | 98.8 /100 | #88 | Exceptional 98.1% |
| Delaware | 98.8 /100 | #89 | Exceptional 98.1% |
| Zimbabweans | 98.8 /100 | #90 | Exceptional 98.1% |
| Hopi | 98.7 /100 | #91 | Exceptional 98.1% |
| Immigrants | South Africa | 98.7 /100 | #92 | Exceptional 98.1% |
| Immigrants | Western Europe | 98.7 /100 | #93 | Exceptional 98.1% |
| Immigrants | Germany | 98.4 /100 | #94 | Exceptional 98.1% |
| Cypriots | 98.4 /100 | #95 | Exceptional 98.1% |
| Immigrants | Ireland | 98.2 /100 | #96 | Exceptional 98.1% |
| South Africans | 98.2 /100 | #97 | Exceptional 98.1% |
| Choctaw | 98.0 /100 | #98 | Exceptional 98.1% |