Mexican American Indian vs Italian High School Diploma
COMPARE
Mexican American Indian
Italian
High School Diploma
High School Diploma Comparison
Mexican American Indians
Italians
83.0%
HIGH SCHOOL DIPLOMA
0.0/ 100
METRIC RATING
326th/ 347
METRIC RANK
91.5%
HIGH SCHOOL DIPLOMA
99.9/ 100
METRIC RATING
24th/ 347
METRIC RANK
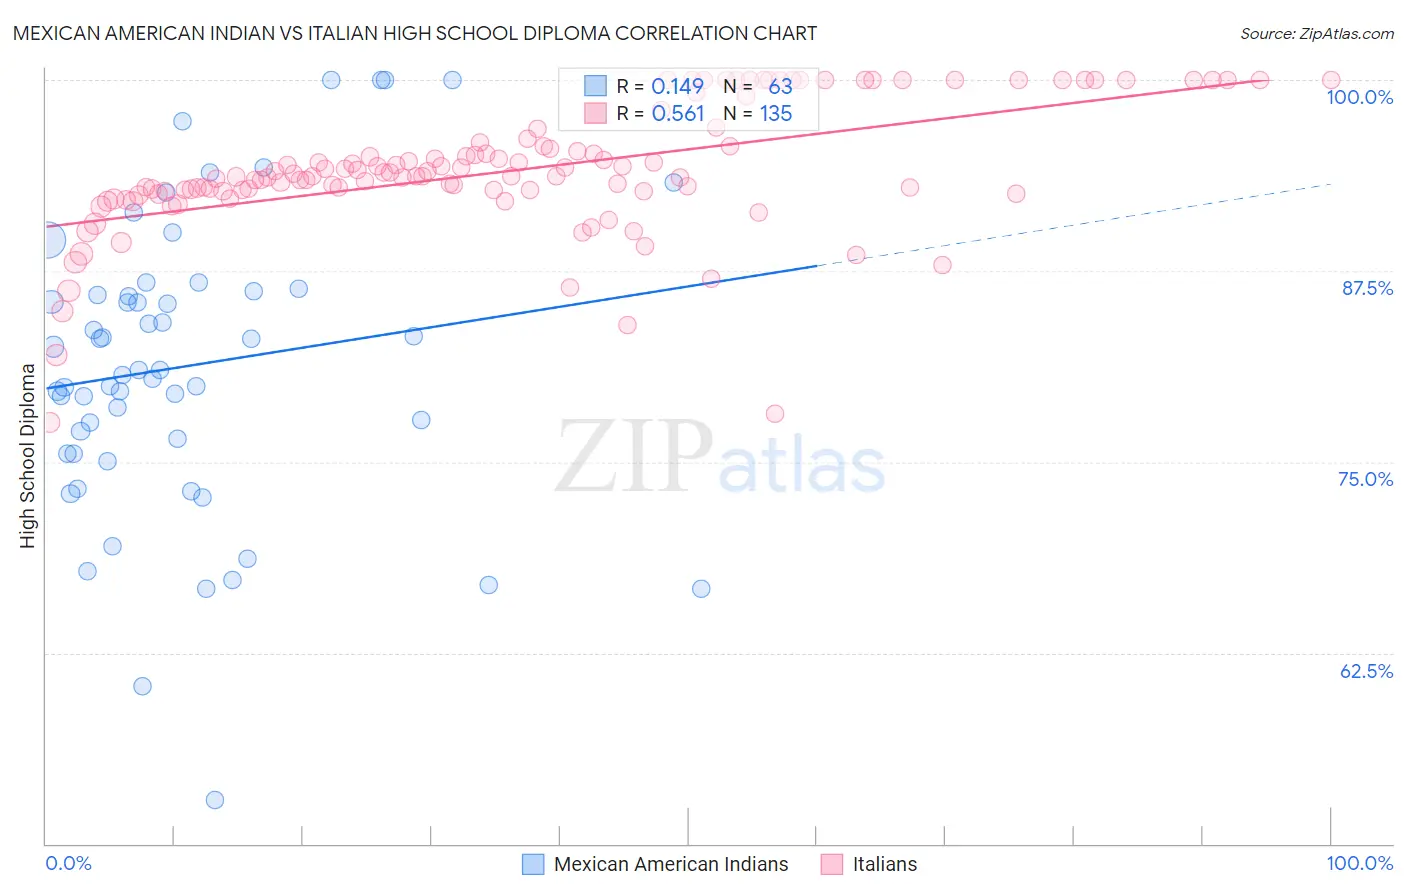
Mexican American Indian vs Italian High School Diploma Correlation Chart
The statistical analysis conducted on geographies consisting of 317,621,155 people shows a poor positive correlation between the proportion of Mexican American Indians and percentage of population with at least high school diploma education in the United States with a correlation coefficient (R) of 0.149 and weighted average of 83.0%. Similarly, the statistical analysis conducted on geographies consisting of 575,116,589 people shows a substantial positive correlation between the proportion of Italians and percentage of population with at least high school diploma education in the United States with a correlation coefficient (R) of 0.561 and weighted average of 91.5%, a difference of 10.3%.
High School Diploma Correlation Summary
| Measurement | Mexican American Indian | Italian |
| Minimum | 52.9% | 77.6% |
| Maximum | 100.0% | 100.0% |
| Range | 47.1% | 22.4% |
| Mean | 81.3% | 94.0% |
| Median | 81.0% | 93.7% |
| Interquartile 25% (IQ1) | 75.6% | 92.7% |
| Interquartile 75% (IQ3) | 86.2% | 95.7% |
| Interquartile Range (IQR) | 10.6% | 2.9% |
| Standard Deviation (Sample) | 9.7% | 4.2% |
| Standard Deviation (Population) | 9.6% | 4.2% |
Similar Demographics by High School Diploma
Demographics Similar to Mexican American Indians by High School Diploma
In terms of high school diploma, the demographic groups most similar to Mexican American Indians are Honduran (83.0%, a difference of 0.040%), Immigrants from Nicaragua (83.1%, a difference of 0.070%), Dominican (82.9%, a difference of 0.090%), Hispanic or Latino (82.9%, a difference of 0.19%), and Immigrants from the Azores (82.8%, a difference of 0.26%).
| Demographics | Rating | Rank | High School Diploma |
| Central American Indians | 0.0 /100 | #319 | Tragic 84.2% |
| Nicaraguans | 0.0 /100 | #320 | Tragic 84.1% |
| Yuman | 0.0 /100 | #321 | Tragic 84.0% |
| Lumbee | 0.0 /100 | #322 | Tragic 83.6% |
| Immigrants | Cuba | 0.0 /100 | #323 | Tragic 83.5% |
| Immigrants | Cabo Verde | 0.0 /100 | #324 | Tragic 83.3% |
| Immigrants | Nicaragua | 0.0 /100 | #325 | Tragic 83.1% |
| Mexican American Indians | 0.0 /100 | #326 | Tragic 83.0% |
| Hondurans | 0.0 /100 | #327 | Tragic 83.0% |
| Dominicans | 0.0 /100 | #328 | Tragic 82.9% |
| Hispanics or Latinos | 0.0 /100 | #329 | Tragic 82.9% |
| Immigrants | Azores | 0.0 /100 | #330 | Tragic 82.8% |
| Central Americans | 0.0 /100 | #331 | Tragic 82.5% |
| Immigrants | Honduras | 0.0 /100 | #332 | Tragic 82.5% |
| Immigrants | Latin America | 0.0 /100 | #333 | Tragic 82.1% |
Demographics Similar to Italians by High School Diploma
In terms of high school diploma, the demographic groups most similar to Italians are Scandinavian (91.5%, a difference of 0.0%), Thai (91.5%, a difference of 0.0%), Estonian (91.6%, a difference of 0.030%), Filipino (91.6%, a difference of 0.040%), and Czech (91.6%, a difference of 0.050%).
| Demographics | Rating | Rank | High School Diploma |
| Immigrants | Singapore | 99.9 /100 | #17 | Exceptional 91.7% |
| Germans | 99.9 /100 | #18 | Exceptional 91.7% |
| Maltese | 99.9 /100 | #19 | Exceptional 91.6% |
| Czechs | 99.9 /100 | #20 | Exceptional 91.6% |
| Filipinos | 99.9 /100 | #21 | Exceptional 91.6% |
| Estonians | 99.9 /100 | #22 | Exceptional 91.6% |
| Scandinavians | 99.9 /100 | #23 | Exceptional 91.5% |
| Italians | 99.9 /100 | #24 | Exceptional 91.5% |
| Thais | 99.9 /100 | #25 | Exceptional 91.5% |
| Russians | 99.9 /100 | #26 | Exceptional 91.5% |
| Cypriots | 99.9 /100 | #27 | Exceptional 91.5% |
| Tlingit-Haida | 99.9 /100 | #28 | Exceptional 91.4% |
| Europeans | 99.9 /100 | #29 | Exceptional 91.4% |
| Iranians | 99.9 /100 | #30 | Exceptional 91.4% |
| Immigrants | Northern Europe | 99.9 /100 | #31 | Exceptional 91.4% |