Sierra Leonean vs Russian High School Diploma
COMPARE
Sierra Leonean
Russian
High School Diploma
High School Diploma Comparison
Sierra Leoneans
Russians
89.1%
HIGH SCHOOL DIPLOMA
48.4/ 100
METRIC RATING
178th/ 347
METRIC RANK
91.5%
HIGH SCHOOL DIPLOMA
99.9/ 100
METRIC RATING
26th/ 347
METRIC RANK
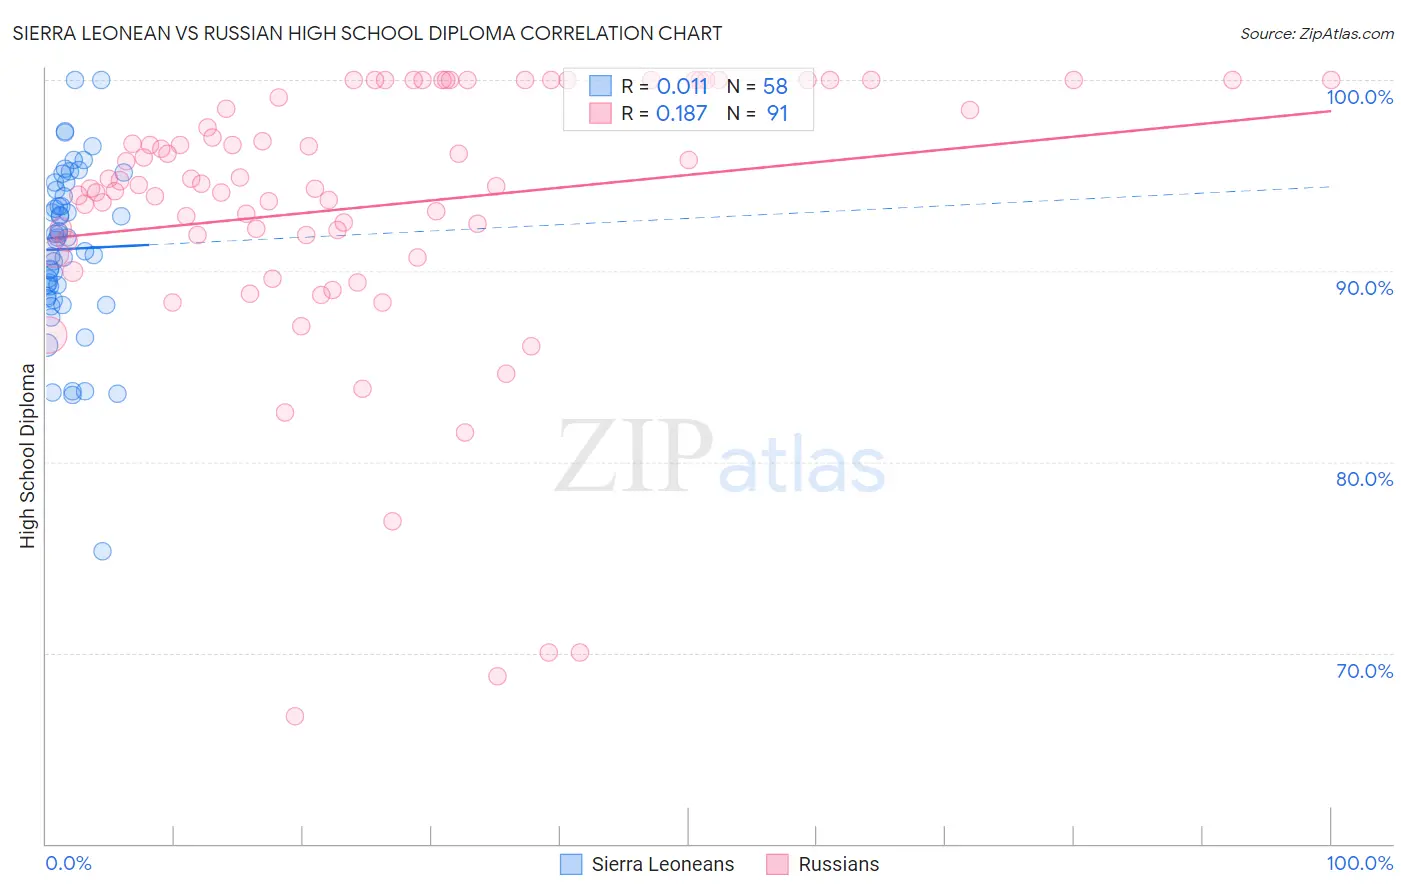
Sierra Leonean vs Russian High School Diploma Correlation Chart
The statistical analysis conducted on geographies consisting of 83,355,497 people shows no correlation between the proportion of Sierra Leoneans and percentage of population with at least high school diploma education in the United States with a correlation coefficient (R) of 0.011 and weighted average of 89.1%. Similarly, the statistical analysis conducted on geographies consisting of 512,259,122 people shows a poor positive correlation between the proportion of Russians and percentage of population with at least high school diploma education in the United States with a correlation coefficient (R) of 0.187 and weighted average of 91.5%, a difference of 2.6%.
High School Diploma Correlation Summary
| Measurement | Sierra Leonean | Russian |
| Minimum | 75.3% | 66.7% |
| Maximum | 100.0% | 100.0% |
| Range | 24.7% | 33.3% |
| Mean | 91.2% | 93.4% |
| Median | 91.7% | 94.5% |
| Interquartile 25% (IQ1) | 88.7% | 91.6% |
| Interquartile 75% (IQ3) | 94.2% | 100.0% |
| Interquartile Range (IQR) | 5.6% | 8.4% |
| Standard Deviation (Sample) | 4.4% | 7.2% |
| Standard Deviation (Population) | 4.4% | 7.2% |
Similar Demographics by High School Diploma
Demographics Similar to Sierra Leoneans by High School Diploma
In terms of high school diploma, the demographic groups most similar to Sierra Leoneans are Sudanese (89.1%, a difference of 0.0%), Immigrants from Western Asia (89.1%, a difference of 0.010%), Osage (89.1%, a difference of 0.010%), Hmong (89.1%, a difference of 0.020%), and American (89.1%, a difference of 0.020%).
| Demographics | Rating | Rank | High School Diploma |
| Spanish | 52.9 /100 | #171 | Average 89.2% |
| Immigrants | Nonimmigrants | 51.8 /100 | #172 | Average 89.2% |
| Immigrants | Indonesia | 50.3 /100 | #173 | Average 89.1% |
| Hmong | 50.0 /100 | #174 | Average 89.1% |
| Immigrants | Western Asia | 49.0 /100 | #175 | Average 89.1% |
| Osage | 48.9 /100 | #176 | Average 89.1% |
| Sudanese | 48.5 /100 | #177 | Average 89.1% |
| Sierra Leoneans | 48.4 /100 | #178 | Average 89.1% |
| Americans | 47.2 /100 | #179 | Average 89.1% |
| Bolivians | 45.2 /100 | #180 | Average 89.1% |
| Venezuelans | 43.6 /100 | #181 | Average 89.1% |
| Spaniards | 43.4 /100 | #182 | Average 89.1% |
| Potawatomi | 42.5 /100 | #183 | Average 89.0% |
| Immigrants | Syria | 39.2 /100 | #184 | Fair 89.0% |
| Ethiopians | 37.0 /100 | #185 | Fair 89.0% |
Demographics Similar to Russians by High School Diploma
In terms of high school diploma, the demographic groups most similar to Russians are Cypriot (91.5%, a difference of 0.010%), Italian (91.5%, a difference of 0.050%), Thai (91.5%, a difference of 0.050%), Tlingit-Haida (91.4%, a difference of 0.050%), and Scandinavian (91.5%, a difference of 0.060%).
| Demographics | Rating | Rank | High School Diploma |
| Maltese | 99.9 /100 | #19 | Exceptional 91.6% |
| Czechs | 99.9 /100 | #20 | Exceptional 91.6% |
| Filipinos | 99.9 /100 | #21 | Exceptional 91.6% |
| Estonians | 99.9 /100 | #22 | Exceptional 91.6% |
| Scandinavians | 99.9 /100 | #23 | Exceptional 91.5% |
| Italians | 99.9 /100 | #24 | Exceptional 91.5% |
| Thais | 99.9 /100 | #25 | Exceptional 91.5% |
| Russians | 99.9 /100 | #26 | Exceptional 91.5% |
| Cypriots | 99.9 /100 | #27 | Exceptional 91.5% |
| Tlingit-Haida | 99.9 /100 | #28 | Exceptional 91.4% |
| Europeans | 99.9 /100 | #29 | Exceptional 91.4% |
| Iranians | 99.9 /100 | #30 | Exceptional 91.4% |
| Immigrants | Northern Europe | 99.9 /100 | #31 | Exceptional 91.4% |
| English | 99.9 /100 | #32 | Exceptional 91.4% |
| Okinawans | 99.9 /100 | #33 | Exceptional 91.4% |