Marshallese vs Immigrants from Denmark High School Diploma
COMPARE
Marshallese
Immigrants from Denmark
High School Diploma
High School Diploma Comparison
Marshallese
Immigrants from Denmark
88.6%
HIGH SCHOOL DIPLOMA
18.7/ 100
METRIC RATING
199th/ 347
METRIC RANK
90.8%
HIGH SCHOOL DIPLOMA
99.3/ 100
METRIC RATING
79th/ 347
METRIC RANK
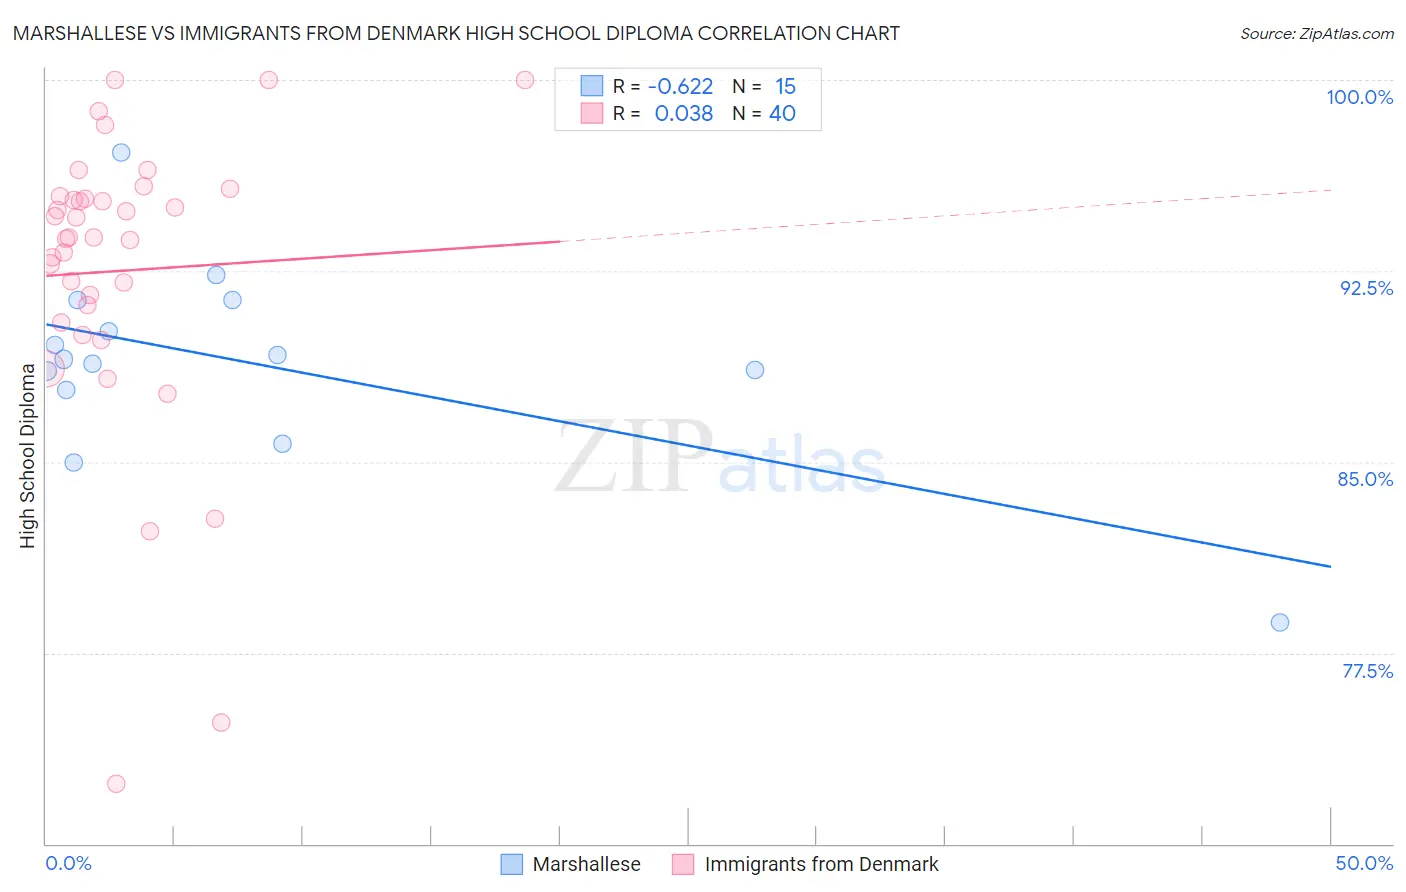
Marshallese vs Immigrants from Denmark High School Diploma Correlation Chart
The statistical analysis conducted on geographies consisting of 14,760,991 people shows a significant negative correlation between the proportion of Marshallese and percentage of population with at least high school diploma education in the United States with a correlation coefficient (R) of -0.622 and weighted average of 88.6%. Similarly, the statistical analysis conducted on geographies consisting of 136,430,715 people shows no correlation between the proportion of Immigrants from Denmark and percentage of population with at least high school diploma education in the United States with a correlation coefficient (R) of 0.038 and weighted average of 90.8%, a difference of 2.4%.
High School Diploma Correlation Summary
| Measurement | Marshallese | Immigrants from Denmark |
| Minimum | 78.7% | 72.3% |
| Maximum | 97.2% | 100.0% |
| Range | 18.5% | 27.7% |
| Mean | 88.9% | 92.5% |
| Median | 89.0% | 93.8% |
| Interquartile 25% (IQ1) | 87.8% | 90.8% |
| Interquartile 75% (IQ3) | 91.3% | 95.4% |
| Interquartile Range (IQR) | 3.5% | 4.6% |
| Standard Deviation (Sample) | 4.0% | 5.9% |
| Standard Deviation (Population) | 3.9% | 5.8% |
Similar Demographics by High School Diploma
Demographics Similar to Marshallese by High School Diploma
In terms of high school diploma, the demographic groups most similar to Marshallese are Liberian (88.7%, a difference of 0.0%), Hawaiian (88.6%, a difference of 0.010%), Korean (88.6%, a difference of 0.010%), Panamanian (88.6%, a difference of 0.020%), and Somali (88.6%, a difference of 0.030%).
| Demographics | Rating | Rank | High School Diploma |
| Moroccans | 29.5 /100 | #192 | Fair 88.8% |
| Immigrants | Oceania | 26.9 /100 | #193 | Fair 88.8% |
| Immigrants | Venezuela | 25.8 /100 | #194 | Fair 88.8% |
| Afghans | 23.9 /100 | #195 | Fair 88.8% |
| Immigrants | Southern Europe | 23.4 /100 | #196 | Fair 88.7% |
| French American Indians | 21.5 /100 | #197 | Fair 88.7% |
| Liberians | 18.8 /100 | #198 | Poor 88.7% |
| Marshallese | 18.7 /100 | #199 | Poor 88.6% |
| Hawaiians | 18.3 /100 | #200 | Poor 88.6% |
| Koreans | 18.1 /100 | #201 | Poor 88.6% |
| Panamanians | 18.0 /100 | #202 | Poor 88.6% |
| Somalis | 17.5 /100 | #203 | Poor 88.6% |
| Armenians | 17.2 /100 | #204 | Poor 88.6% |
| Immigrants | Micronesia | 16.4 /100 | #205 | Poor 88.6% |
| Arapaho | 16.1 /100 | #206 | Poor 88.6% |
Demographics Similar to Immigrants from Denmark by High School Diploma
In terms of high school diploma, the demographic groups most similar to Immigrants from Denmark are Native Hawaiian (90.8%, a difference of 0.010%), Burmese (90.8%, a difference of 0.010%), Immigrants from England (90.8%, a difference of 0.010%), Immigrants from Switzerland (90.8%, a difference of 0.010%), and Hungarian (90.8%, a difference of 0.020%).
| Demographics | Rating | Rank | High School Diploma |
| Soviet Union | 99.4 /100 | #72 | Exceptional 90.9% |
| Immigrants | South Central Asia | 99.4 /100 | #73 | Exceptional 90.9% |
| Immigrants | Czechoslovakia | 99.4 /100 | #74 | Exceptional 90.9% |
| Cambodians | 99.4 /100 | #75 | Exceptional 90.8% |
| Hungarians | 99.3 /100 | #76 | Exceptional 90.8% |
| Native Hawaiians | 99.3 /100 | #77 | Exceptional 90.8% |
| Burmese | 99.3 /100 | #78 | Exceptional 90.8% |
| Immigrants | Denmark | 99.3 /100 | #79 | Exceptional 90.8% |
| Immigrants | England | 99.3 /100 | #80 | Exceptional 90.8% |
| Immigrants | Switzerland | 99.3 /100 | #81 | Exceptional 90.8% |
| Scotch-Irish | 99.2 /100 | #82 | Exceptional 90.8% |
| Immigrants | Moldova | 99.2 /100 | #83 | Exceptional 90.7% |
| Immigrants | Saudi Arabia | 99.1 /100 | #84 | Exceptional 90.7% |
| Romanians | 98.9 /100 | #85 | Exceptional 90.7% |
| Immigrants | Bulgaria | 98.9 /100 | #86 | Exceptional 90.6% |