Marshallese vs Malaysian Kindergarten
COMPARE
Marshallese
Malaysian
Kindergarten
Kindergarten Comparison
Marshallese
Malaysians
98.1%
KINDERGARTEN
83.0/ 100
METRIC RATING
141st/ 347
METRIC RANK
97.2%
KINDERGARTEN
0.0/ 100
METRIC RATING
293rd/ 347
METRIC RANK
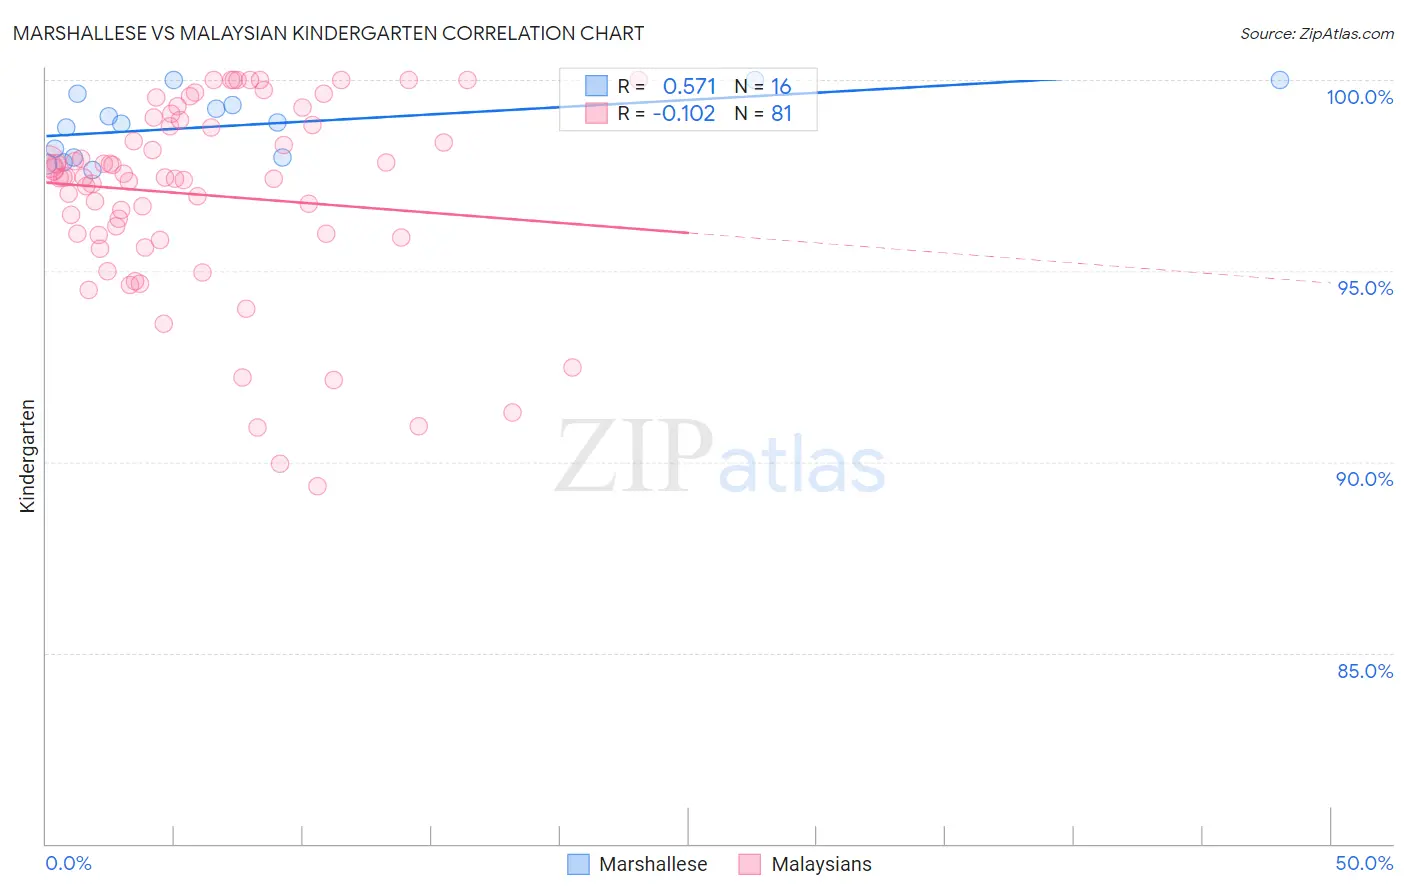
Marshallese vs Malaysian Kindergarten Correlation Chart
The statistical analysis conducted on geographies consisting of 14,761,315 people shows a substantial positive correlation between the proportion of Marshallese and percentage of population with at least kindergarten education in the United States with a correlation coefficient (R) of 0.571 and weighted average of 98.1%. Similarly, the statistical analysis conducted on geographies consisting of 226,107,000 people shows a poor negative correlation between the proportion of Malaysians and percentage of population with at least kindergarten education in the United States with a correlation coefficient (R) of -0.102 and weighted average of 97.2%, a difference of 0.86%.
Kindergarten Correlation Summary
| Measurement | Marshallese | Malaysian |
| Minimum | 97.6% | 89.4% |
| Maximum | 100.0% | 100.0% |
| Range | 2.4% | 10.6% |
| Mean | 98.8% | 97.0% |
| Median | 98.9% | 97.4% |
| Interquartile 25% (IQ1) | 98.0% | 95.9% |
| Interquartile 75% (IQ3) | 99.5% | 98.9% |
| Interquartile Range (IQR) | 1.5% | 3.0% |
| Standard Deviation (Sample) | 0.84% | 2.5% |
| Standard Deviation (Population) | 0.82% | 2.5% |
Similar Demographics by Kindergarten
Demographics Similar to Marshallese by Kindergarten
In terms of kindergarten, the demographic groups most similar to Marshallese are Palestinian (98.1%, a difference of 0.0%), Immigrants from Turkey (98.1%, a difference of 0.0%), Burmese (98.1%, a difference of 0.010%), Alsatian (98.1%, a difference of 0.010%), and Hmong (98.1%, a difference of 0.020%).
| Demographics | Rating | Rank | Kindergarten |
| Immigrants | Bulgaria | 89.4 /100 | #134 | Excellent 98.1% |
| Immigrants | Kuwait | 89.2 /100 | #135 | Excellent 98.1% |
| Immigrants | Hungary | 89.1 /100 | #136 | Excellent 98.1% |
| Blackfeet | 87.8 /100 | #137 | Excellent 98.1% |
| Immigrants | Romania | 87.7 /100 | #138 | Excellent 98.1% |
| Israelis | 87.7 /100 | #139 | Excellent 98.1% |
| Palestinians | 83.6 /100 | #140 | Excellent 98.1% |
| Marshallese | 83.0 /100 | #141 | Excellent 98.1% |
| Immigrants | Turkey | 82.8 /100 | #142 | Excellent 98.1% |
| Burmese | 81.5 /100 | #143 | Excellent 98.1% |
| Alsatians | 80.4 /100 | #144 | Excellent 98.1% |
| Hmong | 78.8 /100 | #145 | Good 98.1% |
| Filipinos | 78.3 /100 | #146 | Good 98.0% |
| Immigrants | Israel | 77.6 /100 | #147 | Good 98.0% |
| Apache | 75.0 /100 | #148 | Good 98.0% |
Demographics Similar to Malaysians by Kindergarten
In terms of kindergarten, the demographic groups most similar to Malaysians are British West Indian (97.3%, a difference of 0.010%), Houma (97.3%, a difference of 0.030%), Immigrants (97.2%, a difference of 0.030%), Immigrants from Grenada (97.2%, a difference of 0.030%), and Immigrants from Eritrea (97.2%, a difference of 0.040%).
| Demographics | Rating | Rank | Kindergarten |
| Immigrants | Barbados | 0.0 /100 | #286 | Tragic 97.3% |
| Immigrants | Hong Kong | 0.0 /100 | #287 | Tragic 97.3% |
| Immigrants | Thailand | 0.0 /100 | #288 | Tragic 97.3% |
| Immigrants | Afghanistan | 0.0 /100 | #289 | Tragic 97.3% |
| Immigrants | St. Vincent and the Grenadines | 0.0 /100 | #290 | Tragic 97.3% |
| Houma | 0.0 /100 | #291 | Tragic 97.3% |
| British West Indians | 0.0 /100 | #292 | Tragic 97.3% |
| Malaysians | 0.0 /100 | #293 | Tragic 97.2% |
| Immigrants | Immigrants | 0.0 /100 | #294 | Tragic 97.2% |
| Immigrants | Grenada | 0.0 /100 | #295 | Tragic 97.2% |
| Immigrants | Eritrea | 0.0 /100 | #296 | Tragic 97.2% |
| Central American Indians | 0.0 /100 | #297 | Tragic 97.2% |
| Immigrants | Dominica | 0.0 /100 | #298 | Tragic 97.1% |
| Immigrants | Cuba | 0.0 /100 | #299 | Tragic 97.1% |
| Haitians | 0.0 /100 | #300 | Tragic 97.1% |