Immigrants from Russia vs Malaysian Kindergarten
COMPARE
Immigrants from Russia
Malaysian
Kindergarten
Kindergarten Comparison
Immigrants from Russia
Malaysians
98.0%
KINDERGARTEN
59.0/ 100
METRIC RATING
160th/ 347
METRIC RANK
97.2%
KINDERGARTEN
0.0/ 100
METRIC RATING
293rd/ 347
METRIC RANK
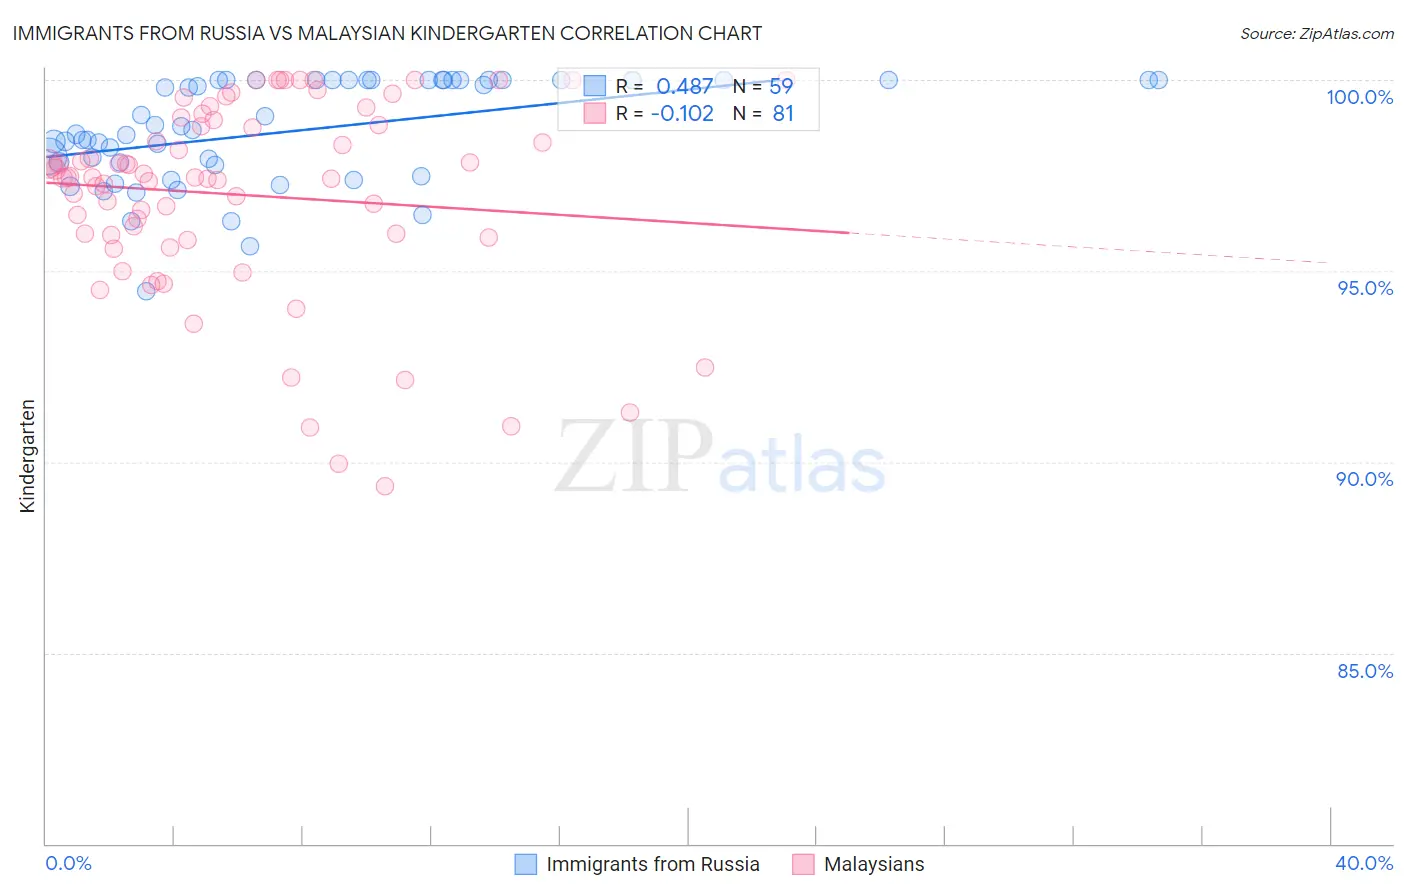
Immigrants from Russia vs Malaysian Kindergarten Correlation Chart
The statistical analysis conducted on geographies consisting of 347,948,494 people shows a moderate positive correlation between the proportion of Immigrants from Russia and percentage of population with at least kindergarten education in the United States with a correlation coefficient (R) of 0.487 and weighted average of 98.0%. Similarly, the statistical analysis conducted on geographies consisting of 226,107,000 people shows a poor negative correlation between the proportion of Malaysians and percentage of population with at least kindergarten education in the United States with a correlation coefficient (R) of -0.102 and weighted average of 97.2%, a difference of 0.76%.
Kindergarten Correlation Summary
| Measurement | Immigrants from Russia | Malaysian |
| Minimum | 94.5% | 89.4% |
| Maximum | 100.0% | 100.0% |
| Range | 5.5% | 10.6% |
| Mean | 98.7% | 97.0% |
| Median | 98.7% | 97.4% |
| Interquartile 25% (IQ1) | 97.8% | 95.9% |
| Interquartile 75% (IQ3) | 100.0% | 98.9% |
| Interquartile Range (IQR) | 2.2% | 3.0% |
| Standard Deviation (Sample) | 1.4% | 2.5% |
| Standard Deviation (Population) | 1.4% | 2.5% |
Similar Demographics by Kindergarten
Demographics Similar to Immigrants from Russia by Kindergarten
In terms of kindergarten, the demographic groups most similar to Immigrants from Russia are Immigrants from Eastern Europe (98.0%, a difference of 0.0%), Immigrants from Italy (98.0%, a difference of 0.0%), Spanish American (98.0%, a difference of 0.0%), Immigrants from Micronesia (98.0%, a difference of 0.0%), and Ugandan (98.0%, a difference of 0.010%).
| Demographics | Rating | Rank | Kindergarten |
| Immigrants | Moldova | 69.1 /100 | #153 | Good 98.0% |
| Immigrants | Iran | 68.8 /100 | #154 | Good 98.0% |
| Comanche | 68.3 /100 | #155 | Good 98.0% |
| Immigrants | South Central Asia | 66.6 /100 | #156 | Good 98.0% |
| Immigrants | North Macedonia | 66.4 /100 | #157 | Good 98.0% |
| Venezuelans | 64.7 /100 | #158 | Good 98.0% |
| French American Indians | 63.7 /100 | #159 | Good 98.0% |
| Immigrants | Russia | 59.0 /100 | #160 | Average 98.0% |
| Immigrants | Eastern Europe | 59.0 /100 | #161 | Average 98.0% |
| Immigrants | Italy | 58.9 /100 | #162 | Average 98.0% |
| Spanish Americans | 57.8 /100 | #163 | Average 98.0% |
| Immigrants | Micronesia | 57.7 /100 | #164 | Average 98.0% |
| Ugandans | 56.9 /100 | #165 | Average 98.0% |
| Chileans | 56.3 /100 | #166 | Average 98.0% |
| Immigrants | Spain | 54.6 /100 | #167 | Average 98.0% |
Demographics Similar to Malaysians by Kindergarten
In terms of kindergarten, the demographic groups most similar to Malaysians are British West Indian (97.3%, a difference of 0.010%), Houma (97.3%, a difference of 0.030%), Immigrants (97.2%, a difference of 0.030%), Immigrants from Grenada (97.2%, a difference of 0.030%), and Immigrants from Eritrea (97.2%, a difference of 0.040%).
| Demographics | Rating | Rank | Kindergarten |
| Immigrants | Barbados | 0.0 /100 | #286 | Tragic 97.3% |
| Immigrants | Hong Kong | 0.0 /100 | #287 | Tragic 97.3% |
| Immigrants | Thailand | 0.0 /100 | #288 | Tragic 97.3% |
| Immigrants | Afghanistan | 0.0 /100 | #289 | Tragic 97.3% |
| Immigrants | St. Vincent and the Grenadines | 0.0 /100 | #290 | Tragic 97.3% |
| Houma | 0.0 /100 | #291 | Tragic 97.3% |
| British West Indians | 0.0 /100 | #292 | Tragic 97.3% |
| Malaysians | 0.0 /100 | #293 | Tragic 97.2% |
| Immigrants | Immigrants | 0.0 /100 | #294 | Tragic 97.2% |
| Immigrants | Grenada | 0.0 /100 | #295 | Tragic 97.2% |
| Immigrants | Eritrea | 0.0 /100 | #296 | Tragic 97.2% |
| Central American Indians | 0.0 /100 | #297 | Tragic 97.2% |
| Immigrants | Dominica | 0.0 /100 | #298 | Tragic 97.1% |
| Immigrants | Cuba | 0.0 /100 | #299 | Tragic 97.1% |
| Haitians | 0.0 /100 | #300 | Tragic 97.1% |