Marshallese vs Immigrants from Nepal 3rd Grade
COMPARE
Marshallese
Immigrants from Nepal
3rd Grade
3rd Grade Comparison
Marshallese
Immigrants from Nepal
97.8%
3RD GRADE
57.2/ 100
METRIC RATING
163rd/ 347
METRIC RANK
97.5%
3RD GRADE
5.3/ 100
METRIC RATING
218th/ 347
METRIC RANK
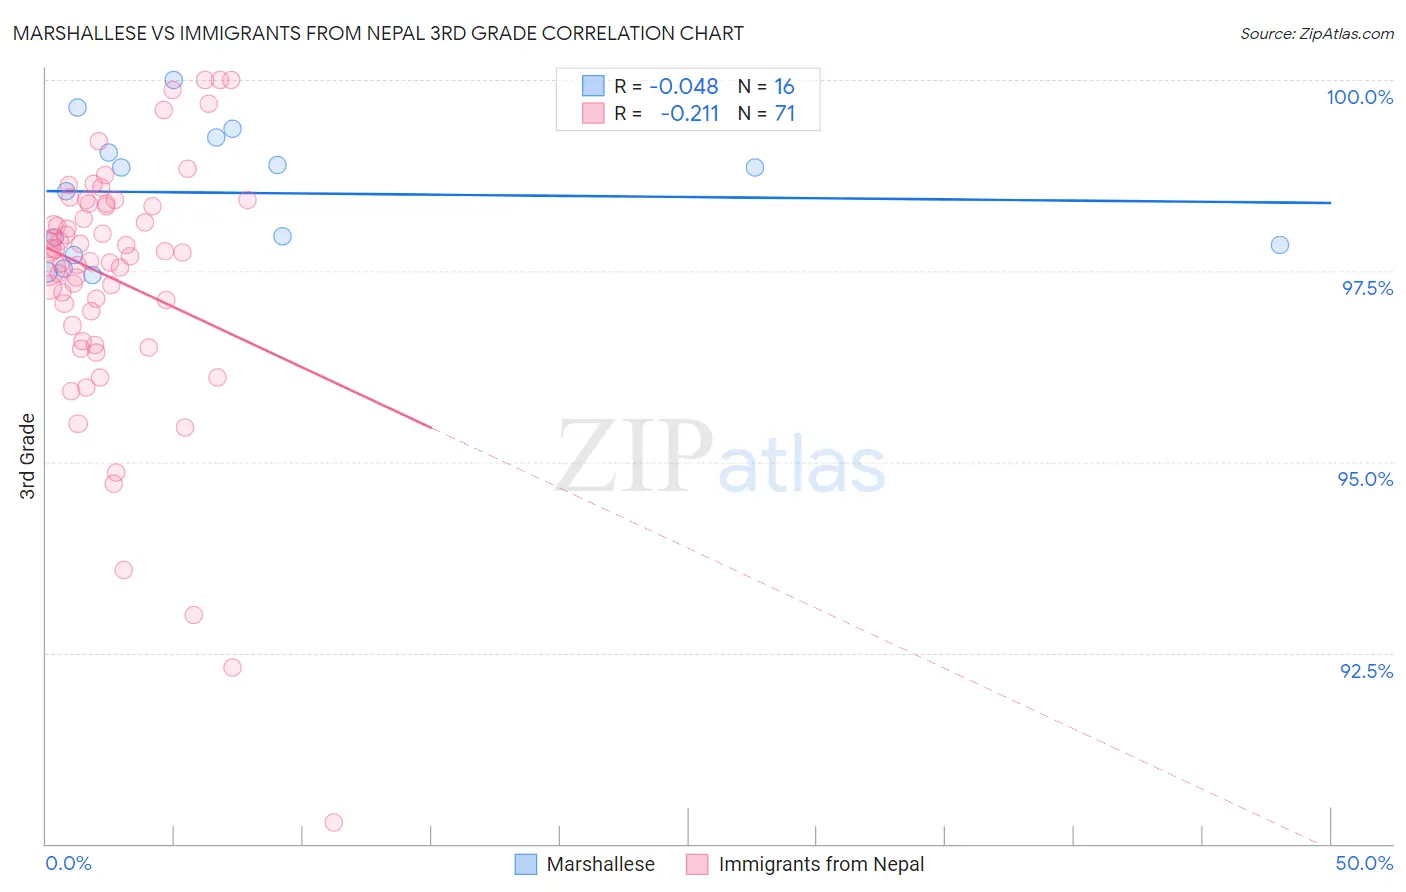
Marshallese vs Immigrants from Nepal 3rd Grade Correlation Chart
The statistical analysis conducted on geographies consisting of 14,761,315 people shows no correlation between the proportion of Marshallese and percentage of population with at least 3rd grade education in the United States with a correlation coefficient (R) of -0.048 and weighted average of 97.8%. Similarly, the statistical analysis conducted on geographies consisting of 186,739,570 people shows a weak negative correlation between the proportion of Immigrants from Nepal and percentage of population with at least 3rd grade education in the United States with a correlation coefficient (R) of -0.211 and weighted average of 97.5%, a difference of 0.27%.
3rd Grade Correlation Summary
| Measurement | Marshallese | Immigrants from Nepal |
| Minimum | 97.4% | 90.3% |
| Maximum | 100.0% | 100.0% |
| Range | 2.6% | 9.7% |
| Mean | 98.5% | 97.4% |
| Median | 98.7% | 97.7% |
| Interquartile 25% (IQ1) | 97.8% | 96.8% |
| Interquartile 75% (IQ3) | 99.1% | 98.4% |
| Interquartile Range (IQR) | 1.4% | 1.6% |
| Standard Deviation (Sample) | 0.83% | 1.7% |
| Standard Deviation (Population) | 0.80% | 1.7% |
Similar Demographics by 3rd Grade
Demographics Similar to Marshallese by 3rd Grade
In terms of 3rd grade, the demographic groups most similar to Marshallese are Immigrants from Jordan (97.8%, a difference of 0.0%), Immigrants from Bosnia and Herzegovina (97.8%, a difference of 0.0%), Ugandan (97.8%, a difference of 0.0%), Immigrants from Italy (97.8%, a difference of 0.010%), and Venezuelan (97.8%, a difference of 0.010%).
| Demographics | Rating | Rank | 3rd Grade |
| Immigrants | Russia | 61.7 /100 | #156 | Good 97.8% |
| Immigrants | Italy | 61.2 /100 | #157 | Good 97.8% |
| Venezuelans | 60.9 /100 | #158 | Good 97.8% |
| French American Indians | 60.0 /100 | #159 | Average 97.8% |
| Immigrants | Iran | 59.1 /100 | #160 | Average 97.8% |
| Albanians | 58.8 /100 | #161 | Average 97.8% |
| Immigrants | Jordan | 57.9 /100 | #162 | Average 97.8% |
| Marshallese | 57.2 /100 | #163 | Average 97.8% |
| Immigrants | Bosnia and Herzegovina | 56.2 /100 | #164 | Average 97.8% |
| Ugandans | 56.1 /100 | #165 | Average 97.8% |
| Dutch West Indians | 55.5 /100 | #166 | Average 97.8% |
| Chileans | 55.3 /100 | #167 | Average 97.8% |
| Immigrants | Spain | 54.3 /100 | #168 | Average 97.8% |
| Comanche | 53.8 /100 | #169 | Average 97.8% |
| Brazilians | 53.7 /100 | #170 | Average 97.8% |
Demographics Similar to Immigrants from Nepal by 3rd Grade
In terms of 3rd grade, the demographic groups most similar to Immigrants from Nepal are Immigrants from Panama (97.5%, a difference of 0.0%), Immigrants from Morocco (97.5%, a difference of 0.0%), South American Indian (97.5%, a difference of 0.010%), Uruguayan (97.5%, a difference of 0.010%), and Sierra Leonean (97.5%, a difference of 0.010%).
| Demographics | Rating | Rank | 3rd Grade |
| Laotians | 9.4 /100 | #211 | Tragic 97.6% |
| Immigrants | Bahamas | 8.5 /100 | #212 | Tragic 97.6% |
| Moroccans | 8.5 /100 | #213 | Tragic 97.6% |
| Yuman | 8.4 /100 | #214 | Tragic 97.6% |
| Iraqis | 6.9 /100 | #215 | Tragic 97.5% |
| Samoans | 6.9 /100 | #216 | Tragic 97.5% |
| South American Indians | 5.7 /100 | #217 | Tragic 97.5% |
| Immigrants | Nepal | 5.3 /100 | #218 | Tragic 97.5% |
| Immigrants | Panama | 5.2 /100 | #219 | Tragic 97.5% |
| Immigrants | Morocco | 5.0 /100 | #220 | Tragic 97.5% |
| Uruguayans | 5.0 /100 | #221 | Tragic 97.5% |
| Sierra Leoneans | 4.6 /100 | #222 | Tragic 97.5% |
| Immigrants | Syria | 4.4 /100 | #223 | Tragic 97.5% |
| Bahamians | 4.4 /100 | #224 | Tragic 97.5% |
| Tongans | 4.3 /100 | #225 | Tragic 97.5% |