Marshallese vs Immigrants from Congo 1st Grade
COMPARE
Marshallese
Immigrants from Congo
1st Grade
1st Grade Comparison
Marshallese
Immigrants from Congo
98.0%
1ST GRADE
82.0/ 100
METRIC RATING
142nd/ 347
METRIC RANK
97.5%
1ST GRADE
0.7/ 100
METRIC RATING
253rd/ 347
METRIC RANK
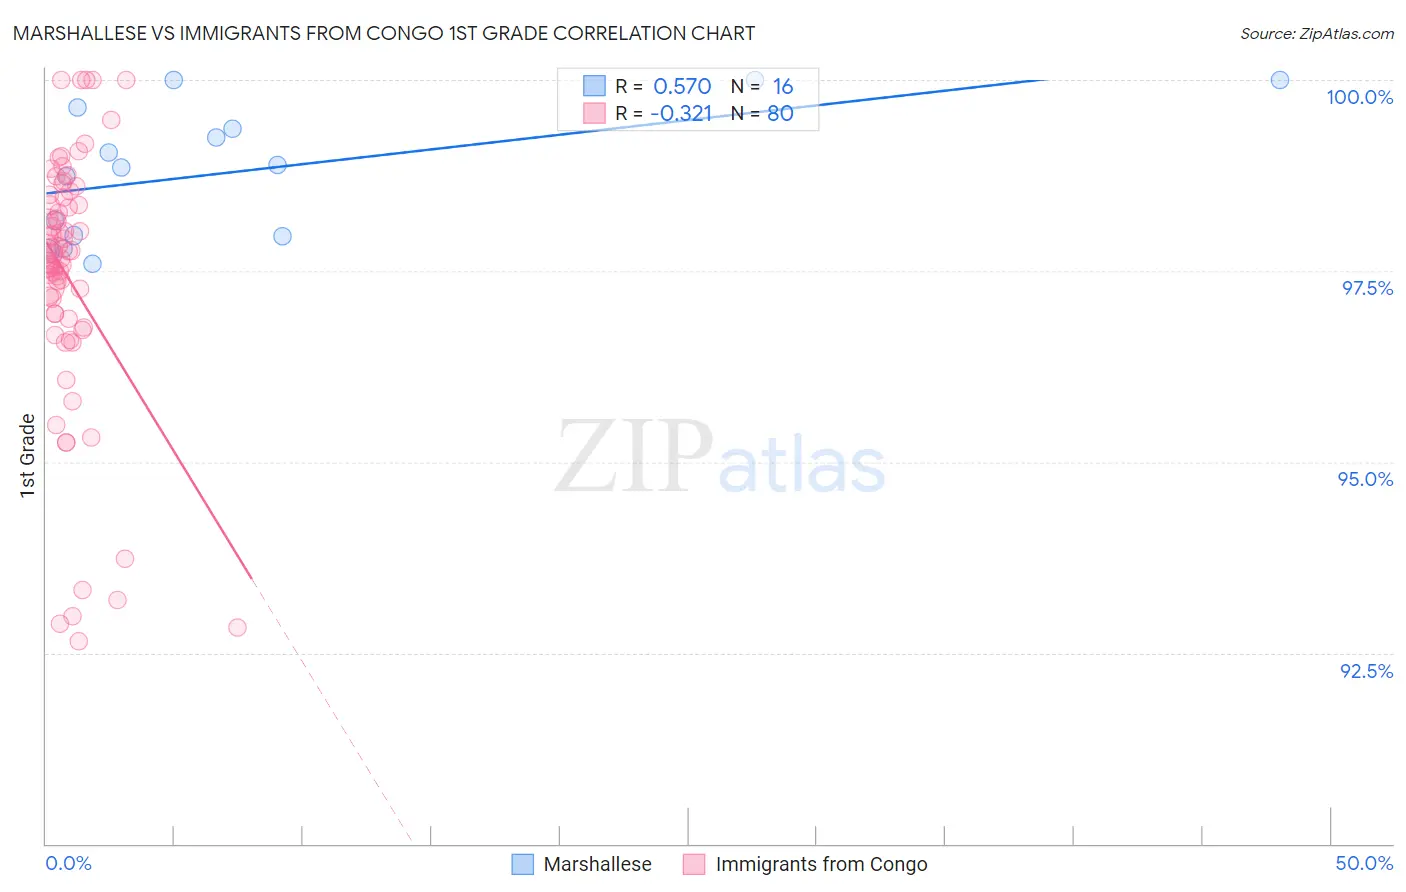
Marshallese vs Immigrants from Congo 1st Grade Correlation Chart
The statistical analysis conducted on geographies consisting of 14,761,315 people shows a substantial positive correlation between the proportion of Marshallese and percentage of population with at least 1st grade education in the United States with a correlation coefficient (R) of 0.570 and weighted average of 98.0%. Similarly, the statistical analysis conducted on geographies consisting of 92,124,753 people shows a mild negative correlation between the proportion of Immigrants from Congo and percentage of population with at least 1st grade education in the United States with a correlation coefficient (R) of -0.321 and weighted average of 97.5%, a difference of 0.50%.
1st Grade Correlation Summary
| Measurement | Marshallese | Immigrants from Congo |
| Minimum | 97.6% | 92.6% |
| Maximum | 100.0% | 100.0% |
| Range | 2.4% | 7.4% |
| Mean | 98.8% | 97.4% |
| Median | 98.9% | 97.7% |
| Interquartile 25% (IQ1) | 98.0% | 96.9% |
| Interquartile 75% (IQ3) | 99.5% | 98.4% |
| Interquartile Range (IQR) | 1.5% | 1.5% |
| Standard Deviation (Sample) | 0.86% | 1.7% |
| Standard Deviation (Population) | 0.83% | 1.7% |
Similar Demographics by 1st Grade
Demographics Similar to Marshallese by 1st Grade
In terms of 1st grade, the demographic groups most similar to Marshallese are Immigrants from Turkey (98.0%, a difference of 0.0%), Palestinian (98.0%, a difference of 0.010%), Burmese (98.0%, a difference of 0.010%), Alsatian (98.0%, a difference of 0.010%), and Hmong (98.0%, a difference of 0.010%).
| Demographics | Rating | Rank | 1st Grade |
| Immigrants | Kuwait | 89.3 /100 | #135 | Excellent 98.1% |
| Immigrants | Bulgaria | 88.8 /100 | #136 | Excellent 98.1% |
| Israelis | 87.8 /100 | #137 | Excellent 98.1% |
| Immigrants | Romania | 87.8 /100 | #138 | Excellent 98.1% |
| Blackfeet | 87.6 /100 | #139 | Excellent 98.1% |
| Palestinians | 83.0 /100 | #140 | Excellent 98.0% |
| Immigrants | Turkey | 82.8 /100 | #141 | Excellent 98.0% |
| Marshallese | 82.0 /100 | #142 | Excellent 98.0% |
| Burmese | 81.0 /100 | #143 | Excellent 98.0% |
| Alsatians | 80.9 /100 | #144 | Excellent 98.0% |
| Hmong | 79.0 /100 | #145 | Good 98.0% |
| Immigrants | Israel | 77.8 /100 | #146 | Good 98.0% |
| Filipinos | 77.6 /100 | #147 | Good 98.0% |
| Apache | 75.2 /100 | #148 | Good 98.0% |
| Immigrants | Greece | 74.9 /100 | #149 | Good 98.0% |
Demographics Similar to Immigrants from Congo by 1st Grade
In terms of 1st grade, the demographic groups most similar to Immigrants from Congo are Immigrants from Asia (97.5%, a difference of 0.0%), Immigrants from Africa (97.6%, a difference of 0.010%), Immigrants from Colombia (97.5%, a difference of 0.010%), Jamaican (97.5%, a difference of 0.010%), and Ethiopian (97.6%, a difference of 0.020%).
| Demographics | Rating | Rank | 1st Grade |
| Immigrants | Eastern Africa | 1.0 /100 | #246 | Tragic 97.6% |
| Peruvians | 1.0 /100 | #247 | Tragic 97.6% |
| Immigrants | Middle Africa | 1.0 /100 | #248 | Tragic 97.6% |
| Immigrants | Senegal | 1.0 /100 | #249 | Tragic 97.6% |
| Ethiopians | 0.9 /100 | #250 | Tragic 97.6% |
| Immigrants | Iraq | 0.9 /100 | #251 | Tragic 97.6% |
| Immigrants | Africa | 0.9 /100 | #252 | Tragic 97.6% |
| Immigrants | Congo | 0.7 /100 | #253 | Tragic 97.5% |
| Immigrants | Asia | 0.7 /100 | #254 | Tragic 97.5% |
| Immigrants | Colombia | 0.6 /100 | #255 | Tragic 97.5% |
| Jamaicans | 0.6 /100 | #256 | Tragic 97.5% |
| Yaqui | 0.6 /100 | #257 | Tragic 97.5% |
| Indians (Asian) | 0.6 /100 | #258 | Tragic 97.5% |
| Fijians | 0.5 /100 | #259 | Tragic 97.5% |
| Armenians | 0.5 /100 | #260 | Tragic 97.5% |