Cape Verdean vs Immigrants from Congo 1st Grade
COMPARE
Cape Verdean
Immigrants from Congo
1st Grade
1st Grade Comparison
Cape Verdeans
Immigrants from Congo
96.9%
1ST GRADE
0.0/ 100
METRIC RATING
312th/ 347
METRIC RANK
97.5%
1ST GRADE
0.7/ 100
METRIC RATING
253rd/ 347
METRIC RANK
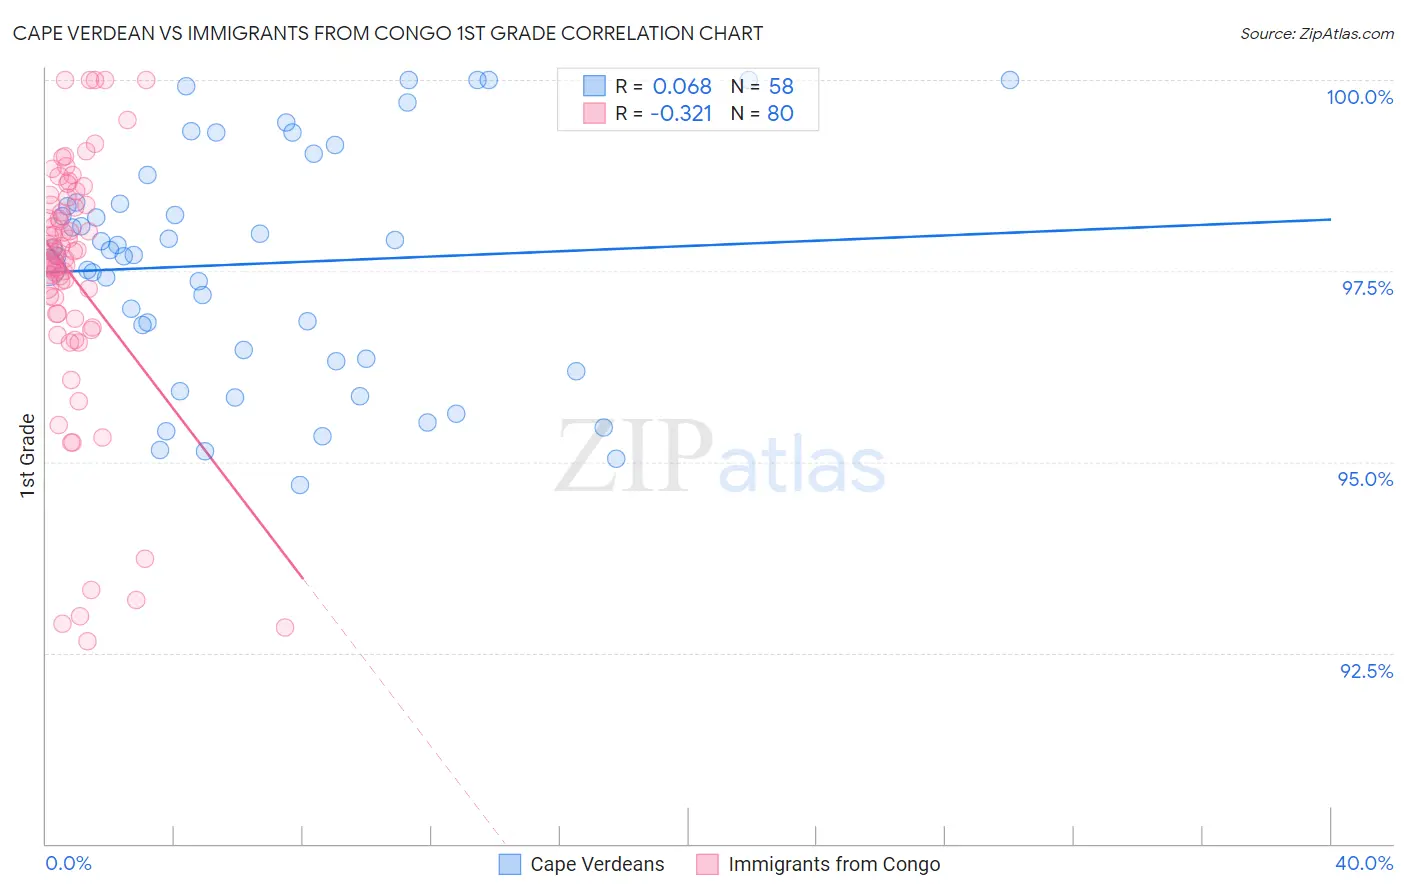
Cape Verdean vs Immigrants from Congo 1st Grade Correlation Chart
The statistical analysis conducted on geographies consisting of 107,537,955 people shows a slight positive correlation between the proportion of Cape Verdeans and percentage of population with at least 1st grade education in the United States with a correlation coefficient (R) of 0.068 and weighted average of 96.9%. Similarly, the statistical analysis conducted on geographies consisting of 92,124,753 people shows a mild negative correlation between the proportion of Immigrants from Congo and percentage of population with at least 1st grade education in the United States with a correlation coefficient (R) of -0.321 and weighted average of 97.5%, a difference of 0.67%.
1st Grade Correlation Summary
| Measurement | Cape Verdean | Immigrants from Congo |
| Minimum | 94.7% | 92.6% |
| Maximum | 100.0% | 100.0% |
| Range | 5.3% | 7.4% |
| Mean | 97.6% | 97.4% |
| Median | 97.7% | 97.7% |
| Interquartile 25% (IQ1) | 96.4% | 96.9% |
| Interquartile 75% (IQ3) | 98.4% | 98.4% |
| Interquartile Range (IQR) | 2.0% | 1.5% |
| Standard Deviation (Sample) | 1.5% | 1.7% |
| Standard Deviation (Population) | 1.5% | 1.7% |
Similar Demographics by 1st Grade
Demographics Similar to Cape Verdeans by 1st Grade
In terms of 1st grade, the demographic groups most similar to Cape Verdeans are Sri Lankan (96.9%, a difference of 0.0%), Guyanese (96.9%, a difference of 0.010%), Honduran (96.9%, a difference of 0.020%), Hispanic or Latino (96.9%, a difference of 0.030%), and Immigrants from Haiti (96.9%, a difference of 0.030%).
| Demographics | Rating | Rank | 1st Grade |
| Ecuadorians | 0.0 /100 | #305 | Tragic 97.0% |
| Belizeans | 0.0 /100 | #306 | Tragic 96.9% |
| Immigrants | Somalia | 0.0 /100 | #307 | Tragic 96.9% |
| Hispanics or Latinos | 0.0 /100 | #308 | Tragic 96.9% |
| Immigrants | Haiti | 0.0 /100 | #309 | Tragic 96.9% |
| Immigrants | Azores | 0.0 /100 | #310 | Tragic 96.9% |
| Sri Lankans | 0.0 /100 | #311 | Tragic 96.9% |
| Cape Verdeans | 0.0 /100 | #312 | Tragic 96.9% |
| Guyanese | 0.0 /100 | #313 | Tragic 96.9% |
| Hondurans | 0.0 /100 | #314 | Tragic 96.9% |
| Immigrants | Belize | 0.0 /100 | #315 | Tragic 96.9% |
| Immigrants | Ecuador | 0.0 /100 | #316 | Tragic 96.9% |
| Immigrants | Nicaragua | 0.0 /100 | #317 | Tragic 96.9% |
| Immigrants | Laos | 0.0 /100 | #318 | Tragic 96.8% |
| Immigrants | Guyana | 0.0 /100 | #319 | Tragic 96.8% |
Demographics Similar to Immigrants from Congo by 1st Grade
In terms of 1st grade, the demographic groups most similar to Immigrants from Congo are Immigrants from Asia (97.5%, a difference of 0.0%), Immigrants from Africa (97.6%, a difference of 0.010%), Immigrants from Colombia (97.5%, a difference of 0.010%), Jamaican (97.5%, a difference of 0.010%), and Ethiopian (97.6%, a difference of 0.020%).
| Demographics | Rating | Rank | 1st Grade |
| Immigrants | Eastern Africa | 1.0 /100 | #246 | Tragic 97.6% |
| Peruvians | 1.0 /100 | #247 | Tragic 97.6% |
| Immigrants | Middle Africa | 1.0 /100 | #248 | Tragic 97.6% |
| Immigrants | Senegal | 1.0 /100 | #249 | Tragic 97.6% |
| Ethiopians | 0.9 /100 | #250 | Tragic 97.6% |
| Immigrants | Iraq | 0.9 /100 | #251 | Tragic 97.6% |
| Immigrants | Africa | 0.9 /100 | #252 | Tragic 97.6% |
| Immigrants | Congo | 0.7 /100 | #253 | Tragic 97.5% |
| Immigrants | Asia | 0.7 /100 | #254 | Tragic 97.5% |
| Immigrants | Colombia | 0.6 /100 | #255 | Tragic 97.5% |
| Jamaicans | 0.6 /100 | #256 | Tragic 97.5% |
| Yaqui | 0.6 /100 | #257 | Tragic 97.5% |
| Indians (Asian) | 0.6 /100 | #258 | Tragic 97.5% |
| Fijians | 0.5 /100 | #259 | Tragic 97.5% |
| Armenians | 0.5 /100 | #260 | Tragic 97.5% |