Seminole vs Hmong 1st Grade
COMPARE
Seminole
Hmong
1st Grade
1st Grade Comparison
Seminole
Hmong
98.1%
1ST GRADE
91.9/ 100
METRIC RATING
129th/ 347
METRIC RANK
98.0%
1ST GRADE
79.0/ 100
METRIC RATING
145th/ 347
METRIC RANK
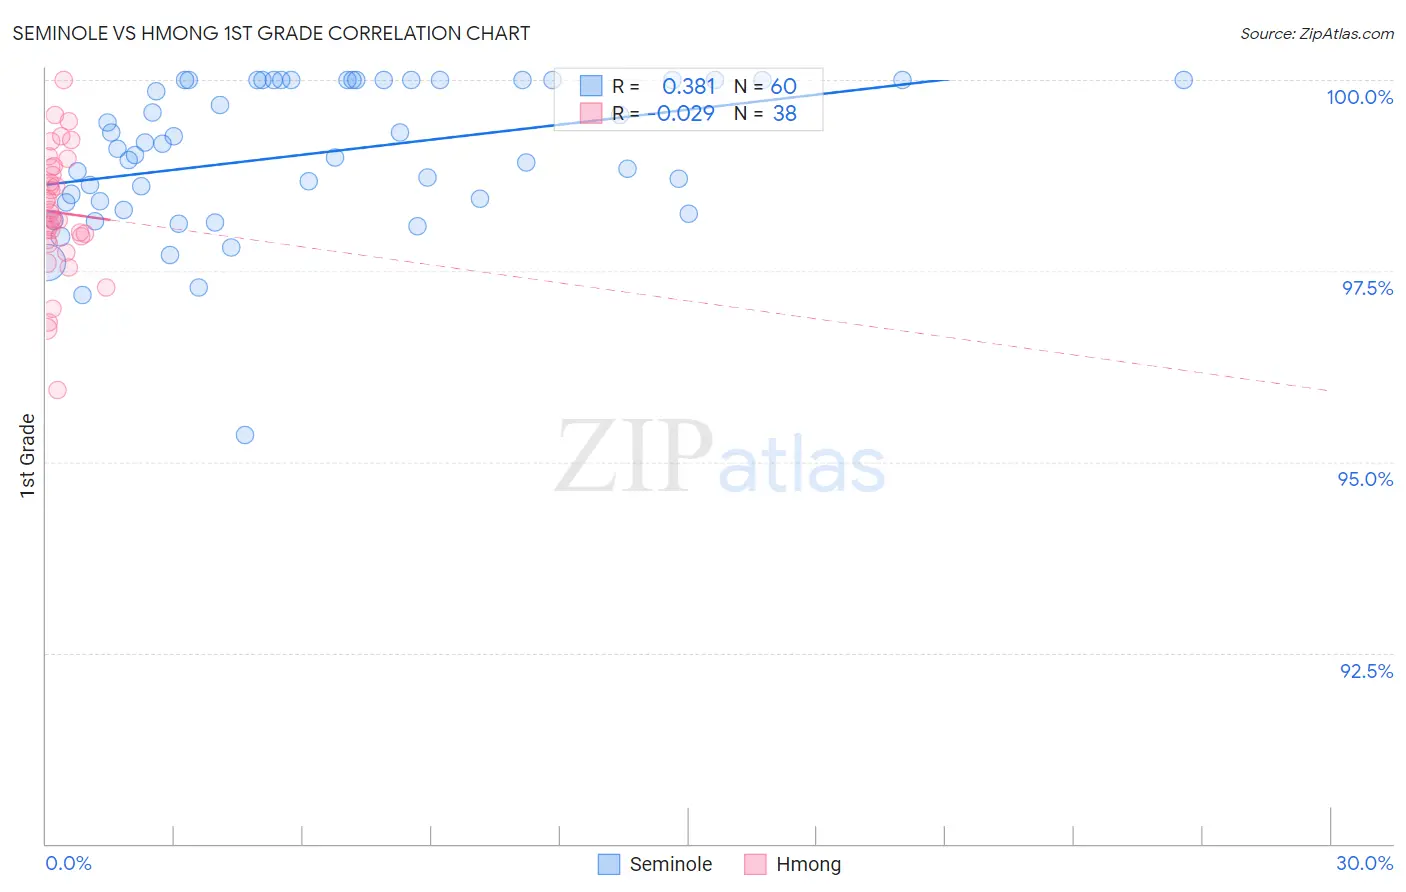
Seminole vs Hmong 1st Grade Correlation Chart
The statistical analysis conducted on geographies consisting of 118,313,258 people shows a mild positive correlation between the proportion of Seminole and percentage of population with at least 1st grade education in the United States with a correlation coefficient (R) of 0.381 and weighted average of 98.1%. Similarly, the statistical analysis conducted on geographies consisting of 24,672,093 people shows no correlation between the proportion of Hmong and percentage of population with at least 1st grade education in the United States with a correlation coefficient (R) of -0.029 and weighted average of 98.0%, a difference of 0.090%.
1st Grade Correlation Summary
| Measurement | Seminole | Hmong |
| Minimum | 95.3% | 95.9% |
| Maximum | 100.0% | 100.0% |
| Range | 4.7% | 4.1% |
| Mean | 99.0% | 98.3% |
| Median | 99.1% | 98.2% |
| Interquartile 25% (IQ1) | 98.4% | 97.9% |
| Interquartile 75% (IQ3) | 100.0% | 98.9% |
| Interquartile Range (IQR) | 1.6% | 0.95% |
| Standard Deviation (Sample) | 0.96% | 0.83% |
| Standard Deviation (Population) | 0.95% | 0.82% |
Demographics Similar to Seminole and Hmong by 1st Grade
In terms of 1st grade, the demographic groups most similar to Seminole are Immigrants from Serbia (98.1%, a difference of 0.0%), Immigrants from Croatia (98.1%, a difference of 0.0%), Spaniard (98.1%, a difference of 0.010%), Cambodian (98.1%, a difference of 0.010%), and Immigrants from Europe (98.1%, a difference of 0.010%). Similarly, the demographic groups most similar to Hmong are Marshallese (98.0%, a difference of 0.010%), Burmese (98.0%, a difference of 0.010%), Alsatian (98.0%, a difference of 0.010%), Immigrants from Israel (98.0%, a difference of 0.010%), and Filipino (98.0%, a difference of 0.010%).
| Demographics | Rating | Rank | 1st Grade |
| Immigrants | Saudi Arabia | 93.3 /100 | #127 | Exceptional 98.1% |
| Immigrants | Serbia | 92.2 /100 | #128 | Exceptional 98.1% |
| Seminole | 91.9 /100 | #129 | Exceptional 98.1% |
| Immigrants | Croatia | 91.4 /100 | #130 | Exceptional 98.1% |
| Spaniards | 91.2 /100 | #131 | Exceptional 98.1% |
| Cambodians | 90.9 /100 | #132 | Exceptional 98.1% |
| Immigrants | Europe | 90.5 /100 | #133 | Exceptional 98.1% |
| Immigrants | Hungary | 89.4 /100 | #134 | Excellent 98.1% |
| Immigrants | Kuwait | 89.3 /100 | #135 | Excellent 98.1% |
| Immigrants | Bulgaria | 88.8 /100 | #136 | Excellent 98.1% |
| Israelis | 87.8 /100 | #137 | Excellent 98.1% |
| Immigrants | Romania | 87.8 /100 | #138 | Excellent 98.1% |
| Blackfeet | 87.6 /100 | #139 | Excellent 98.1% |
| Palestinians | 83.0 /100 | #140 | Excellent 98.0% |
| Immigrants | Turkey | 82.8 /100 | #141 | Excellent 98.0% |
| Marshallese | 82.0 /100 | #142 | Excellent 98.0% |
| Burmese | 81.0 /100 | #143 | Excellent 98.0% |
| Alsatians | 80.9 /100 | #144 | Excellent 98.0% |
| Hmong | 79.0 /100 | #145 | Good 98.0% |
| Immigrants | Israel | 77.8 /100 | #146 | Good 98.0% |
| Filipinos | 77.6 /100 | #147 | Good 98.0% |