Immigrants from Israel vs Alsatian 8th Grade
COMPARE
Immigrants from Israel
Alsatian
8th Grade
8th Grade Comparison
Immigrants from Israel
Alsatians
96.0%
8TH GRADE
81.3/ 100
METRIC RATING
149th/ 347
METRIC RANK
95.8%
8TH GRADE
61.4/ 100
METRIC RATING
165th/ 347
METRIC RANK
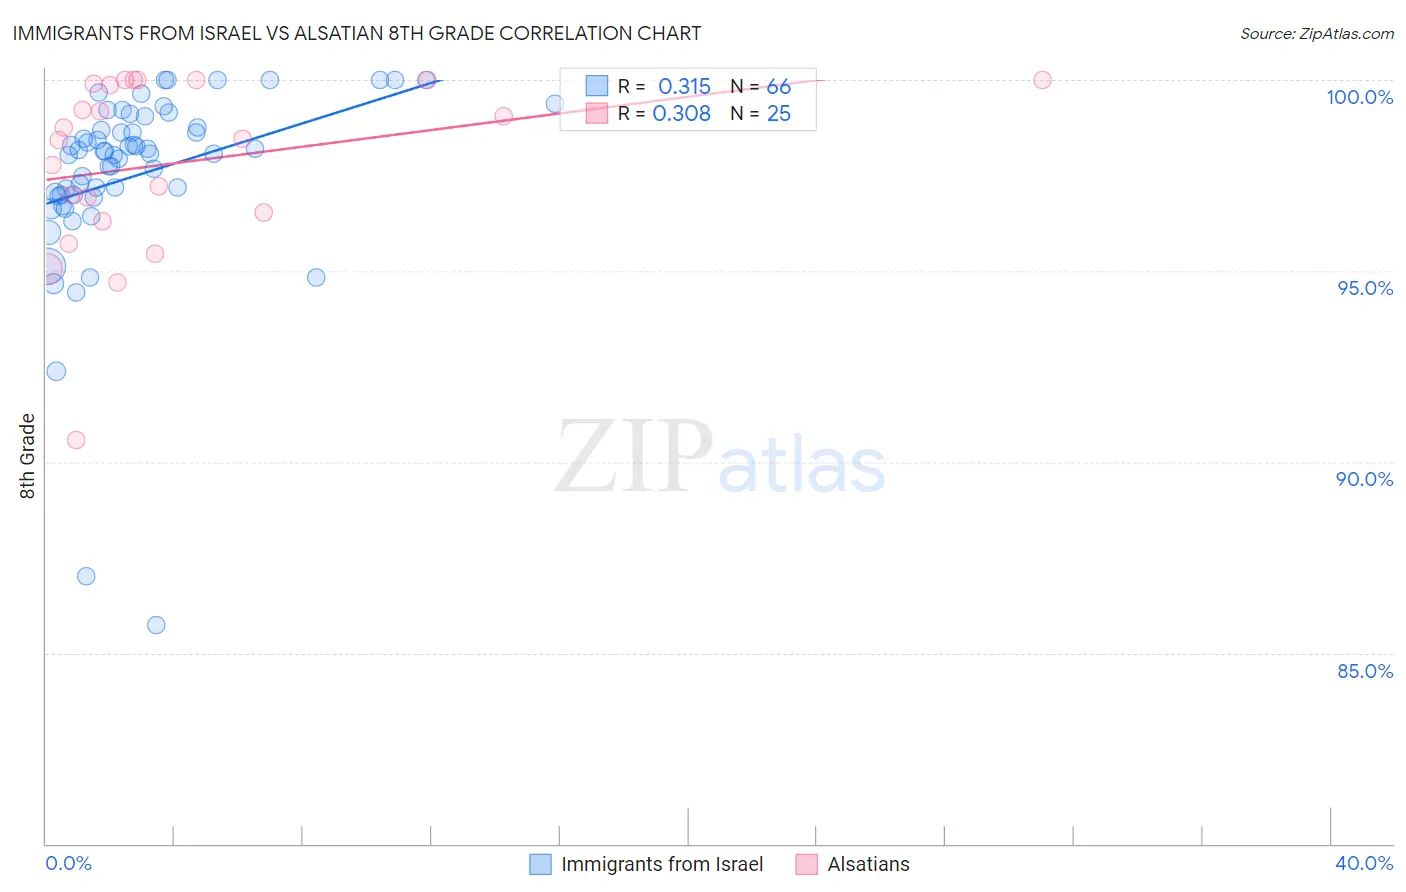
Immigrants from Israel vs Alsatian 8th Grade Correlation Chart
The statistical analysis conducted on geographies consisting of 210,030,386 people shows a mild positive correlation between the proportion of Immigrants from Israel and percentage of population with at least 8th grade education in the United States with a correlation coefficient (R) of 0.315 and weighted average of 96.0%. Similarly, the statistical analysis conducted on geographies consisting of 82,682,365 people shows a mild positive correlation between the proportion of Alsatians and percentage of population with at least 8th grade education in the United States with a correlation coefficient (R) of 0.308 and weighted average of 95.8%, a difference of 0.16%.
8th Grade Correlation Summary
| Measurement | Immigrants from Israel | Alsatian |
| Minimum | 85.7% | 90.6% |
| Maximum | 100.0% | 100.0% |
| Range | 14.3% | 9.4% |
| Mean | 97.5% | 97.8% |
| Median | 98.1% | 98.5% |
| Interquartile 25% (IQ1) | 97.0% | 96.4% |
| Interquartile 75% (IQ3) | 98.8% | 100.0% |
| Interquartile Range (IQR) | 1.8% | 3.5% |
| Standard Deviation (Sample) | 2.5% | 2.3% |
| Standard Deviation (Population) | 2.5% | 2.3% |
Demographics Similar to Immigrants from Israel and Alsatians by 8th Grade
In terms of 8th grade, the demographic groups most similar to Immigrants from Israel are Immigrants from Russia (96.0%, a difference of 0.0%), Blackfeet (96.0%, a difference of 0.010%), French American Indian (96.0%, a difference of 0.010%), Albanian (96.0%, a difference of 0.020%), and Immigrants from Jordan (95.9%, a difference of 0.020%). Similarly, the demographic groups most similar to Alsatians are Immigrants from Poland (95.8%, a difference of 0.0%), Immigrants from Italy (95.8%, a difference of 0.010%), Spaniard (95.8%, a difference of 0.010%), Immigrants from Sri Lanka (95.8%, a difference of 0.020%), and Seminole (95.8%, a difference of 0.040%).
| Demographics | Rating | Rank | 8th Grade |
| Colville | 84.0 /100 | #147 | Excellent 96.0% |
| Albanians | 83.1 /100 | #148 | Excellent 96.0% |
| Immigrants | Israel | 81.3 /100 | #149 | Excellent 96.0% |
| Immigrants | Russia | 80.9 /100 | #150 | Excellent 96.0% |
| Blackfeet | 80.8 /100 | #151 | Excellent 96.0% |
| French American Indians | 80.6 /100 | #152 | Excellent 96.0% |
| Immigrants | Jordan | 79.5 /100 | #153 | Good 95.9% |
| Hopi | 79.4 /100 | #154 | Good 95.9% |
| Kenyans | 74.5 /100 | #155 | Good 95.9% |
| Ugandans | 74.1 /100 | #156 | Good 95.9% |
| Immigrants | Taiwan | 70.5 /100 | #157 | Good 95.9% |
| Arabs | 69.4 /100 | #158 | Good 95.9% |
| Immigrants | Kazakhstan | 68.4 /100 | #159 | Good 95.9% |
| Seminole | 67.7 /100 | #160 | Good 95.8% |
| Bermudans | 67.5 /100 | #161 | Good 95.8% |
| Immigrants | Kenya | 67.2 /100 | #162 | Good 95.8% |
| Immigrants | Sri Lanka | 64.1 /100 | #163 | Good 95.8% |
| Immigrants | Italy | 63.5 /100 | #164 | Good 95.8% |
| Alsatians | 61.4 /100 | #165 | Good 95.8% |
| Immigrants | Poland | 61.1 /100 | #166 | Good 95.8% |
| Spaniards | 60.0 /100 | #167 | Good 95.8% |