Choctaw vs Tohono O'odham 3rd Grade
COMPARE
Choctaw
Tohono O'odham
3rd Grade
3rd Grade Comparison
Choctaw
Tohono O'odham
98.1%
3RD GRADE
98.0/ 100
METRIC RATING
98th/ 347
METRIC RANK
97.6%
3RD GRADE
12.5/ 100
METRIC RATING
207th/ 347
METRIC RANK
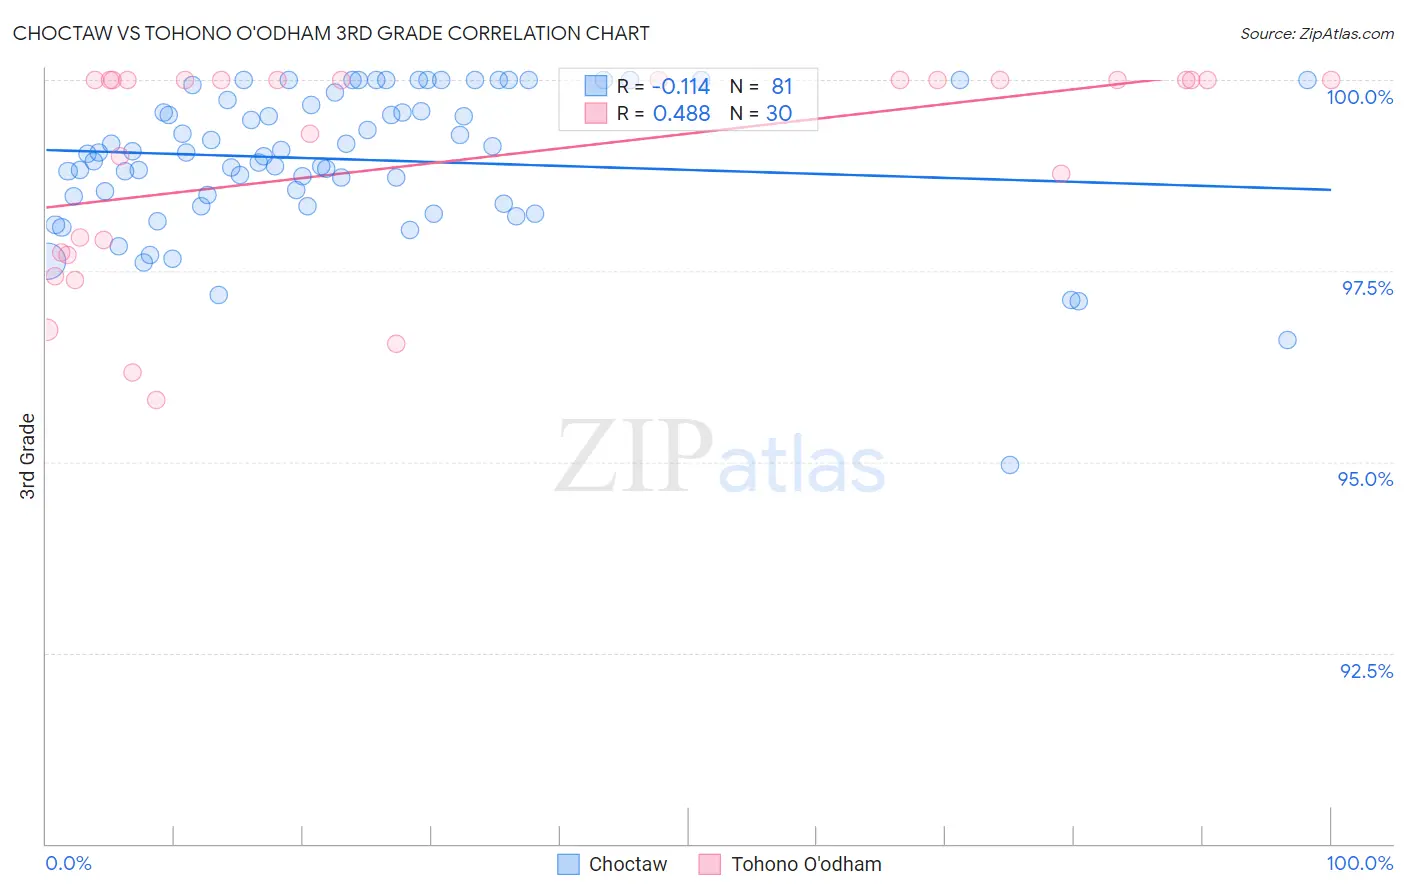
Choctaw vs Tohono O'odham 3rd Grade Correlation Chart
The statistical analysis conducted on geographies consisting of 269,742,875 people shows a poor negative correlation between the proportion of Choctaw and percentage of population with at least 3rd grade education in the United States with a correlation coefficient (R) of -0.114 and weighted average of 98.1%. Similarly, the statistical analysis conducted on geographies consisting of 58,723,100 people shows a moderate positive correlation between the proportion of Tohono O'odham and percentage of population with at least 3rd grade education in the United States with a correlation coefficient (R) of 0.488 and weighted average of 97.6%, a difference of 0.50%.
3rd Grade Correlation Summary
| Measurement | Choctaw | Tohono O'odham |
| Minimum | 95.0% | 95.8% |
| Maximum | 100.0% | 100.0% |
| Range | 5.0% | 4.2% |
| Mean | 99.0% | 98.9% |
| Median | 99.1% | 100.0% |
| Interquartile 25% (IQ1) | 98.4% | 97.7% |
| Interquartile 75% (IQ3) | 99.8% | 100.0% |
| Interquartile Range (IQR) | 1.4% | 2.3% |
| Standard Deviation (Sample) | 0.95% | 1.4% |
| Standard Deviation (Population) | 0.94% | 1.4% |
Similar Demographics by 3rd Grade
Demographics Similar to Choctaw by 3rd Grade
In terms of 3rd grade, the demographic groups most similar to Choctaw are Romanian (98.1%, a difference of 0.0%), Cree (98.1%, a difference of 0.0%), Immigrants from Ireland (98.1%, a difference of 0.010%), South African (98.1%, a difference of 0.010%), and Puget Sound Salish (98.1%, a difference of 0.010%).
| Demographics | Rating | Rank | 3rd Grade |
| Hopi | 98.7 /100 | #91 | Exceptional 98.1% |
| Immigrants | South Africa | 98.7 /100 | #92 | Exceptional 98.1% |
| Immigrants | Western Europe | 98.7 /100 | #93 | Exceptional 98.1% |
| Immigrants | Germany | 98.4 /100 | #94 | Exceptional 98.1% |
| Cypriots | 98.4 /100 | #95 | Exceptional 98.1% |
| Immigrants | Ireland | 98.2 /100 | #96 | Exceptional 98.1% |
| South Africans | 98.2 /100 | #97 | Exceptional 98.1% |
| Choctaw | 98.0 /100 | #98 | Exceptional 98.1% |
| Romanians | 98.0 /100 | #99 | Exceptional 98.1% |
| Cree | 97.9 /100 | #100 | Exceptional 98.1% |
| Puget Sound Salish | 97.9 /100 | #101 | Exceptional 98.1% |
| Immigrants | Nonimmigrants | 97.8 /100 | #102 | Exceptional 98.1% |
| Yugoslavians | 97.7 /100 | #103 | Exceptional 98.1% |
| Turks | 97.6 /100 | #104 | Exceptional 98.1% |
| German Russians | 97.2 /100 | #105 | Exceptional 98.1% |
Demographics Similar to Tohono O'odham by 3rd Grade
In terms of 3rd grade, the demographic groups most similar to Tohono O'odham are Immigrants from Northern Africa (97.6%, a difference of 0.0%), Immigrants from Zaire (97.6%, a difference of 0.0%), African (97.6%, a difference of 0.010%), Costa Rican (97.6%, a difference of 0.020%), and Immigrants from Southern Europe (97.6%, a difference of 0.030%).
| Demographics | Rating | Rank | 3rd Grade |
| Immigrants | Albania | 22.6 /100 | #200 | Fair 97.7% |
| Immigrants | Lebanon | 21.7 /100 | #201 | Fair 97.7% |
| Immigrants | Southern Europe | 17.7 /100 | #202 | Poor 97.6% |
| Paiute | 16.7 /100 | #203 | Poor 97.6% |
| Immigrants | Chile | 16.5 /100 | #204 | Poor 97.6% |
| Africans | 14.5 /100 | #205 | Poor 97.6% |
| Immigrants | Northern Africa | 13.0 /100 | #206 | Poor 97.6% |
| Tohono O'odham | 12.5 /100 | #207 | Poor 97.6% |
| Immigrants | Zaire | 11.9 /100 | #208 | Poor 97.6% |
| Costa Ricans | 9.6 /100 | #209 | Tragic 97.6% |
| Immigrants | Oceania | 9.5 /100 | #210 | Tragic 97.6% |
| Laotians | 9.4 /100 | #211 | Tragic 97.6% |
| Immigrants | Bahamas | 8.5 /100 | #212 | Tragic 97.6% |
| Moroccans | 8.5 /100 | #213 | Tragic 97.6% |
| Yuman | 8.4 /100 | #214 | Tragic 97.6% |