Macedonian vs Immigrants from Yemen 9th Grade
COMPARE
Macedonian
Immigrants from Yemen
9th Grade
9th Grade Comparison
Macedonians
Immigrants from Yemen
96.0%
9TH GRADE
99.8/ 100
METRIC RATING
57th/ 347
METRIC RANK
90.8%
9TH GRADE
0.0/ 100
METRIC RATING
333rd/ 347
METRIC RANK
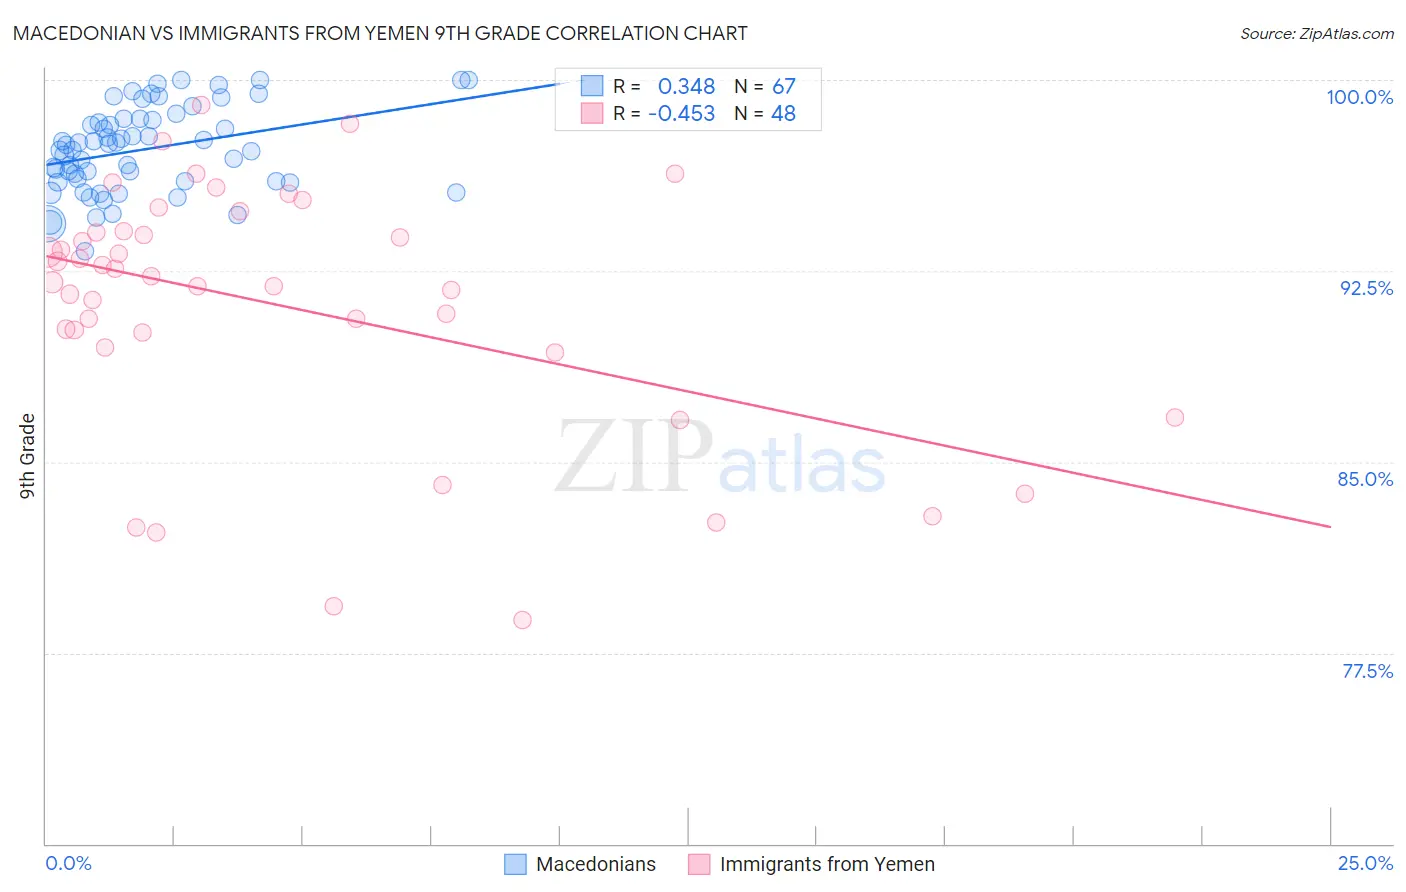
Macedonian vs Immigrants from Yemen 9th Grade Correlation Chart
The statistical analysis conducted on geographies consisting of 132,581,663 people shows a mild positive correlation between the proportion of Macedonians and percentage of population with at least 9th grade education in the United States with a correlation coefficient (R) of 0.348 and weighted average of 96.0%. Similarly, the statistical analysis conducted on geographies consisting of 82,421,120 people shows a moderate negative correlation between the proportion of Immigrants from Yemen and percentage of population with at least 9th grade education in the United States with a correlation coefficient (R) of -0.453 and weighted average of 90.8%, a difference of 5.7%.
9th Grade Correlation Summary
| Measurement | Macedonian | Immigrants from Yemen |
| Minimum | 93.3% | 78.8% |
| Maximum | 100.0% | 99.0% |
| Range | 6.7% | 20.2% |
| Mean | 97.3% | 91.1% |
| Median | 97.5% | 92.2% |
| Interquartile 25% (IQ1) | 96.0% | 89.8% |
| Interquartile 75% (IQ3) | 98.5% | 94.0% |
| Interquartile Range (IQR) | 2.5% | 4.3% |
| Standard Deviation (Sample) | 1.7% | 4.9% |
| Standard Deviation (Population) | 1.6% | 4.8% |
Similar Demographics by 9th Grade
Demographics Similar to Macedonians by 9th Grade
In terms of 9th grade, the demographic groups most similar to Macedonians are Aleut (96.0%, a difference of 0.0%), Immigrants from Austria (96.0%, a difference of 0.010%), Immigrants from North America (96.0%, a difference of 0.010%), New Zealander (95.9%, a difference of 0.020%), and Immigrants from Canada (96.0%, a difference of 0.030%).
| Demographics | Rating | Rank | 9th Grade |
| Celtics | 99.9 /100 | #50 | Exceptional 96.0% |
| Immigrants | Northern Europe | 99.9 /100 | #51 | Exceptional 96.0% |
| Serbians | 99.9 /100 | #52 | Exceptional 96.0% |
| Austrians | 99.8 /100 | #53 | Exceptional 96.0% |
| Immigrants | Canada | 99.8 /100 | #54 | Exceptional 96.0% |
| Immigrants | Austria | 99.8 /100 | #55 | Exceptional 96.0% |
| Immigrants | North America | 99.8 /100 | #56 | Exceptional 96.0% |
| Macedonians | 99.8 /100 | #57 | Exceptional 96.0% |
| Aleuts | 99.8 /100 | #58 | Exceptional 96.0% |
| New Zealanders | 99.8 /100 | #59 | Exceptional 95.9% |
| Native Hawaiians | 99.8 /100 | #60 | Exceptional 95.9% |
| Sioux | 99.8 /100 | #61 | Exceptional 95.9% |
| Ukrainians | 99.7 /100 | #62 | Exceptional 95.9% |
| Canadians | 99.7 /100 | #63 | Exceptional 95.9% |
| Zimbabweans | 99.7 /100 | #64 | Exceptional 95.9% |
Demographics Similar to Immigrants from Yemen by 9th Grade
In terms of 9th grade, the demographic groups most similar to Immigrants from Yemen are Immigrants from the Azores (90.8%, a difference of 0.050%), Hispanic or Latino (90.9%, a difference of 0.090%), Mexican American Indian (90.9%, a difference of 0.11%), Immigrants from Cabo Verde (90.9%, a difference of 0.14%), and Immigrants from Honduras (90.6%, a difference of 0.22%).
| Demographics | Rating | Rank | 9th Grade |
| Immigrants | Armenia | 0.0 /100 | #326 | Tragic 91.4% |
| Immigrants | Nicaragua | 0.0 /100 | #327 | Tragic 91.3% |
| Dominicans | 0.0 /100 | #328 | Tragic 91.1% |
| Hondurans | 0.0 /100 | #329 | Tragic 91.0% |
| Immigrants | Cabo Verde | 0.0 /100 | #330 | Tragic 90.9% |
| Mexican American Indians | 0.0 /100 | #331 | Tragic 90.9% |
| Hispanics or Latinos | 0.0 /100 | #332 | Tragic 90.9% |
| Immigrants | Yemen | 0.0 /100 | #333 | Tragic 90.8% |
| Immigrants | Azores | 0.0 /100 | #334 | Tragic 90.8% |
| Immigrants | Honduras | 0.0 /100 | #335 | Tragic 90.6% |
| Immigrants | Dominican Republic | 0.0 /100 | #336 | Tragic 90.5% |
| Immigrants | Latin America | 0.0 /100 | #337 | Tragic 90.4% |
| Central Americans | 0.0 /100 | #338 | Tragic 90.4% |
| Yakama | 0.0 /100 | #339 | Tragic 90.1% |
| Mexicans | 0.0 /100 | #340 | Tragic 90.0% |