Iroquois vs Sri Lankan 11th Grade
COMPARE
Iroquois
Sri Lankan
11th Grade
11th Grade Comparison
Iroquois
Sri Lankans
92.8%
11TH GRADE
79.1/ 100
METRIC RATING
146th/ 347
METRIC RANK
90.7%
11TH GRADE
0.0/ 100
METRIC RATING
280th/ 347
METRIC RANK
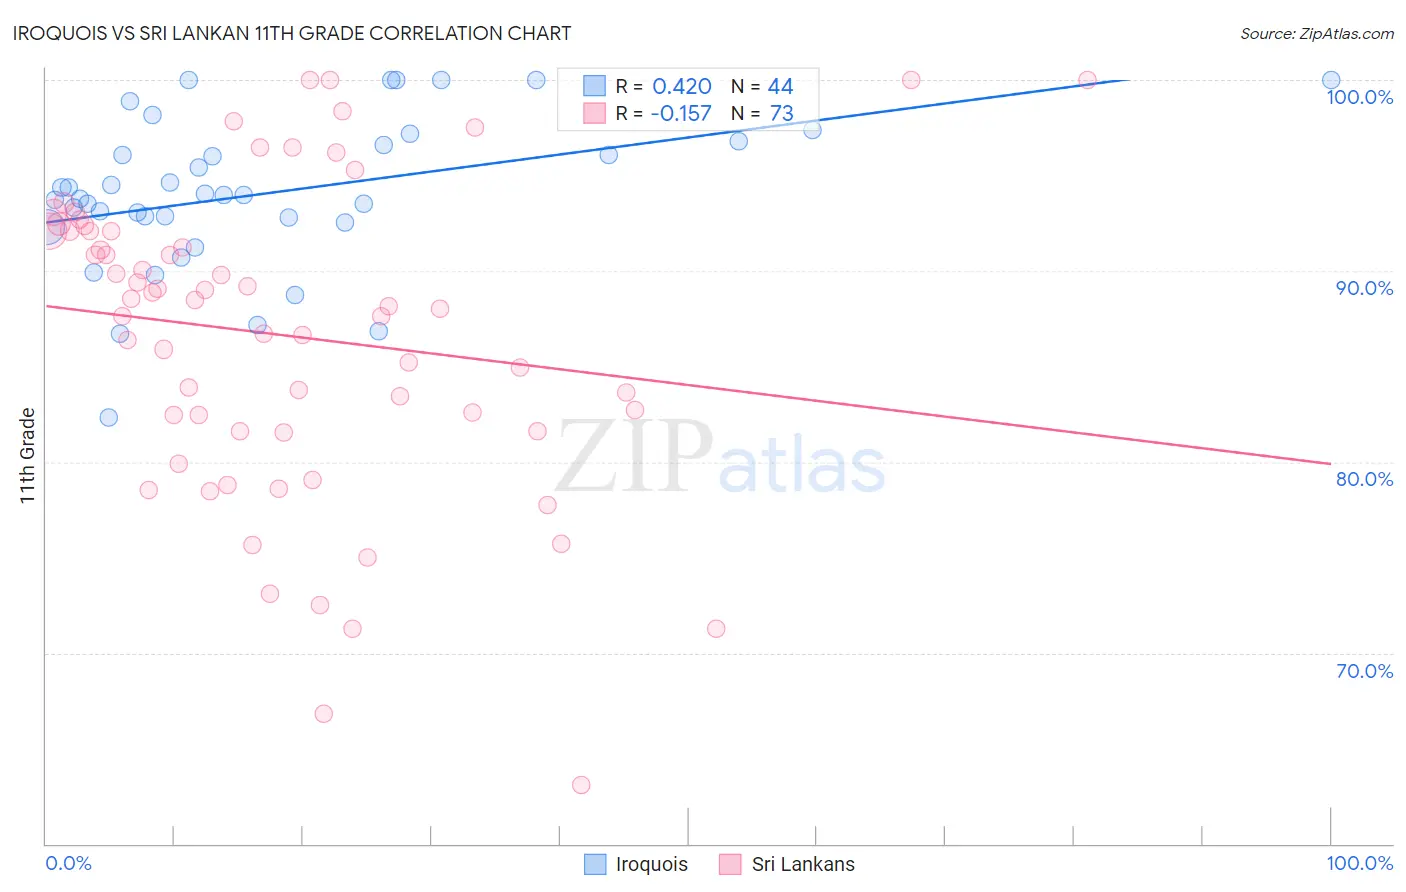
Iroquois vs Sri Lankan 11th Grade Correlation Chart
The statistical analysis conducted on geographies consisting of 207,308,653 people shows a moderate positive correlation between the proportion of Iroquois and percentage of population with at least 11th grade education in the United States with a correlation coefficient (R) of 0.420 and weighted average of 92.8%. Similarly, the statistical analysis conducted on geographies consisting of 440,593,537 people shows a poor negative correlation between the proportion of Sri Lankans and percentage of population with at least 11th grade education in the United States with a correlation coefficient (R) of -0.157 and weighted average of 90.7%, a difference of 2.3%.
11th Grade Correlation Summary
| Measurement | Iroquois | Sri Lankan |
| Minimum | 82.3% | 63.1% |
| Maximum | 100.0% | 100.0% |
| Range | 17.7% | 36.9% |
| Mean | 94.1% | 86.6% |
| Median | 94.0% | 88.1% |
| Interquartile 25% (IQ1) | 92.7% | 81.6% |
| Interquartile 75% (IQ3) | 96.7% | 92.1% |
| Interquartile Range (IQR) | 4.0% | 10.5% |
| Standard Deviation (Sample) | 4.0% | 8.2% |
| Standard Deviation (Population) | 4.0% | 8.1% |
Similar Demographics by 11th Grade
Demographics Similar to Iroquois by 11th Grade
In terms of 11th grade, the demographic groups most similar to Iroquois are Pakistani (92.8%, a difference of 0.010%), Immigrants from Kenya (92.8%, a difference of 0.010%), Hmong (92.8%, a difference of 0.010%), Immigrants from Poland (92.8%, a difference of 0.010%), and Assyrian/Chaldean/Syriac (92.8%, a difference of 0.020%).
| Demographics | Rating | Rank | 11th Grade |
| Crow | 84.1 /100 | #139 | Excellent 92.9% |
| Venezuelans | 83.4 /100 | #140 | Excellent 92.9% |
| Chileans | 83.0 /100 | #141 | Excellent 92.9% |
| Kenyans | 82.0 /100 | #142 | Excellent 92.9% |
| Ugandans | 81.4 /100 | #143 | Excellent 92.9% |
| Assyrians/Chaldeans/Syriacs | 80.5 /100 | #144 | Excellent 92.8% |
| Pakistanis | 79.6 /100 | #145 | Good 92.8% |
| Iroquois | 79.1 /100 | #146 | Good 92.8% |
| Immigrants | Kenya | 78.7 /100 | #147 | Good 92.8% |
| Hmong | 78.6 /100 | #148 | Good 92.8% |
| Immigrants | Poland | 78.5 /100 | #149 | Good 92.8% |
| Immigrants | Egypt | 77.5 /100 | #150 | Good 92.8% |
| Potawatomi | 74.3 /100 | #151 | Good 92.8% |
| Iraqis | 74.2 /100 | #152 | Good 92.8% |
| Brazilians | 73.9 /100 | #153 | Good 92.8% |
Demographics Similar to Sri Lankans by 11th Grade
In terms of 11th grade, the demographic groups most similar to Sri Lankans are Dutch West Indian (90.7%, a difference of 0.050%), Barbadian (90.8%, a difference of 0.060%), Immigrants from St. Vincent and the Grenadines (90.7%, a difference of 0.060%), Immigrants from Barbados (90.7%, a difference of 0.070%), and Malaysian (90.8%, a difference of 0.11%).
| Demographics | Rating | Rank | 11th Grade |
| Paiute | 0.1 /100 | #273 | Tragic 91.0% |
| Immigrants | Trinidad and Tobago | 0.1 /100 | #274 | Tragic 90.9% |
| Immigrants | South Eastern Asia | 0.1 /100 | #275 | Tragic 90.9% |
| Bangladeshis | 0.1 /100 | #276 | Tragic 90.9% |
| Immigrants | Congo | 0.1 /100 | #277 | Tragic 90.9% |
| Malaysians | 0.1 /100 | #278 | Tragic 90.8% |
| Barbadians | 0.0 /100 | #279 | Tragic 90.8% |
| Sri Lankans | 0.0 /100 | #280 | Tragic 90.7% |
| Dutch West Indians | 0.0 /100 | #281 | Tragic 90.7% |
| Immigrants | St. Vincent and the Grenadines | 0.0 /100 | #282 | Tragic 90.7% |
| Immigrants | Barbados | 0.0 /100 | #283 | Tragic 90.7% |
| Immigrants | Laos | 0.0 /100 | #284 | Tragic 90.5% |
| Immigrants | Burma/Myanmar | 0.0 /100 | #285 | Tragic 90.4% |
| Immigrants | West Indies | 0.0 /100 | #286 | Tragic 90.4% |
| Apache | 0.0 /100 | #287 | Tragic 90.4% |