Paraguayan vs Spanish American Master's Degree

COMPARE

Paraguayan
Race
Ancestry
AfghanAfricanAlaska NativeAlaskan AthabascanAlbanianAleutAlsatianAmericanApacheArabArapahoArgentineanArmenianAssyrian/Chaldean/SyriacAustralianAustrianBahamianBangladeshiBarbadianBasqueBelgianBelizeanBermudanBhutaneseBlackfeetBolivianBrazilianBritishBritish West IndianBulgarianBurmeseCajunCambodianCanadianCape VerdeanCarpatho RusynCelticCentral AmericanCentral American IndianCherokeeCheyenneChickasawChileanChineseChippewaChoctawColombianColvilleComancheCosta RicanCreeCreekCroatianCrowCubanCypriotCzechCzechoslovakianDanishDelawareDominicanDutchDutch West IndianEastern EuropeanEcuadorianEgyptianEnglishEstonianEthiopianEuropeanFijianFilipinoFinnishFrenchFrench American IndianFrench CanadianGermanGerman RussianGhanaianGreekGuamanian/ChamorroGuatemalanGuyaneseHaitianHmongHonduranHopiHoumaHungarianIcelanderIndian (Asian)IndonesianInupiatIranianIraqiIrishIroquoisIsraeliItalianJamaicanJapaneseJordanianKenyanKiowaKoreanLaotianLatvianLebaneseLiberianLithuanianLumbeeLuxembourgerMacedonianMalaysianMalteseMarshalleseMenomineeMexicanMexican American IndianMongolianMoroccanNative HawaiianNavajoNepaleseNew ZealanderNicaraguanNigerianNorthern EuropeanNorwegianOkinawanOsageOttawaPaiutePakistaniPalestinianPanamanianParaguayanPennsylvania GermanPeruvianPimaPolishPortuguesePotawatomiPuebloPuerto RicanPuget Sound SalishRomanianRussianSalvadoranSamoanScandinavianScotch-IrishScottishSeminoleSenegaleseSerbianShoshoneSierra LeoneanSiouxSlavicSlovakSloveneSomaliSouth AfricanSouth AmericanSouth American IndianSoviet UnionSpaniardSpanishSpanish American IndianSri LankanSubsaharan AfricanSudaneseSwedishSwissSyrianTaiwaneseThaiTlingit-HaidaTohono O'OdhamTonganTrinidadian and TobagonianTsimshianTurkishU.S. Virgin IslanderUgandanUkrainianUruguayanUteVenezuelanVietnameseWelshWest IndianYakamaYaquiYugoslavianYumanYup'ikZimbabwean
Immigration
NonimmigrantsImmigrantsAfghanistanAfricaAlbaniaArgentinaArmeniaAsiaAustraliaAustriaBahamasBangladeshBarbadosBelarusBelgiumBelizeBoliviaBosnia and HerzegovinaBrazilBulgariaBurma/MyanmarCabo VerdeCambodiaCameroonCanadaCaribbeanCentral AmericaChileChinaColombiaCongoCosta RicaCroatiaCubaCzechoslovakiaDenmarkDominicaDominican RepublicEastern AfricaEastern AsiaEastern EuropeEcuadorEgyptEl SalvadorEnglandEritreaEthiopiaEuropeFijiFranceGermanyGhanaGreeceGrenadaGuatemalaGuyanaHaitiHondurasHong KongHungaryIndiaIndonesiaIranIraqIrelandIsraelItalyJamaicaJapanJordanKazakhstanKenyaKoreaKuwaitLaosLatin AmericaLatviaLebanonLiberiaLithuaniaMalaysiaMexicoMicronesiaMiddle AfricaMoldovaMoroccoNepalNetherlandsNicaraguaNigeriaNorth AmericaNorth MacedoniaNorthern AfricaNorthern EuropeNorwayOceaniaPakistanPanamaPeruPhilippinesPolandPortugalRomaniaRussiaSaudi ArabiaScotlandSenegalSerbiaSierra LeoneSingaporeSomaliaSouth AfricaSouth AmericaSouth Central AsiaSouth Eastern AsiaSouthern EuropeSpainSri LankaSt. Vincent and the GrenadinesSudanSwedenSwitzerlandSyriaTaiwanThailandTrinidad and TobagoTurkeyUgandaUkraineUruguayUzbekistanVenezuelaVietnamWest IndiesWestern AfricaWestern AsiaWestern EuropeYemenZaireZimbabweAzores
Spanish American
Race
Ancestry
AfghanAfricanAlaska NativeAlaskan AthabascanAlbanianAleutAlsatianAmericanApacheArabArapahoArgentineanArmenianAssyrian/Chaldean/SyriacAustralianAustrianBahamianBangladeshiBarbadianBasqueBelgianBelizeanBermudanBhutaneseBlackfeetBolivianBrazilianBritishBritish West IndianBulgarianBurmeseCajunCambodianCanadianCape VerdeanCarpatho RusynCelticCentral AmericanCentral American IndianCherokeeCheyenneChickasawChileanChineseChippewaChoctawColombianColvilleComancheCosta RicanCreeCreekCroatianCrowCubanCypriotCzechCzechoslovakianDanishDelawareDominicanDutchDutch West IndianEastern EuropeanEcuadorianEgyptianEnglishEstonianEthiopianEuropeanFijianFilipinoFinnishFrenchFrench American IndianFrench CanadianGermanGerman RussianGhanaianGreekGuamanian/ChamorroGuatemalanGuyaneseHaitianHmongHonduranHopiHoumaHungarianIcelanderIndian (Asian)IndonesianInupiatIranianIraqiIrishIroquoisIsraeliItalianJamaicanJapaneseJordanianKenyanKiowaKoreanLaotianLatvianLebaneseLiberianLithuanianLumbeeLuxembourgerMacedonianMalaysianMalteseMarshalleseMenomineeMexicanMexican American IndianMongolianMoroccanNative HawaiianNavajoNepaleseNew ZealanderNicaraguanNigerianNorthern EuropeanNorwegianOkinawanOsageOttawaPaiutePakistaniPalestinianPanamanianPennsylvania GermanPeruvianPimaPolishPortuguesePotawatomiPuebloPuerto RicanPuget Sound SalishRomanianRussianSalvadoranSamoanScandinavianScotch-IrishScottishSeminoleSenegaleseSerbianShoshoneSierra LeoneanSiouxSlavicSlovakSloveneSomaliSouth AfricanSouth AmericanSouth American IndianSoviet UnionSpaniardSpanishSpanish AmericanSpanish American IndianSri LankanSubsaharan AfricanSudaneseSwedishSwissSyrianTaiwaneseThaiTlingit-HaidaTohono O'OdhamTonganTrinidadian and TobagonianTsimshianTurkishU.S. Virgin IslanderUgandanUkrainianUruguayanUteVenezuelanVietnameseWelshWest IndianYakamaYaquiYugoslavianYumanYup'ikZimbabwean
Immigration
NonimmigrantsImmigrantsAfghanistanAfricaAlbaniaArgentinaArmeniaAsiaAustraliaAustriaBahamasBangladeshBarbadosBelarusBelgiumBelizeBoliviaBosnia and HerzegovinaBrazilBulgariaBurma/MyanmarCabo VerdeCambodiaCameroonCanadaCaribbeanCentral AmericaChileChinaColombiaCongoCosta RicaCroatiaCubaCzechoslovakiaDenmarkDominicaDominican RepublicEastern AfricaEastern AsiaEastern EuropeEcuadorEgyptEl SalvadorEnglandEritreaEthiopiaEuropeFijiFranceGermanyGhanaGreeceGrenadaGuatemalaGuyanaHaitiHondurasHong KongHungaryIndiaIndonesiaIranIraqIrelandIsraelItalyJamaicaJapanJordanKazakhstanKenyaKoreaKuwaitLaosLatin AmericaLatviaLebanonLiberiaLithuaniaMalaysiaMexicoMicronesiaMiddle AfricaMoldovaMoroccoNepalNetherlandsNicaraguaNigeriaNorth AmericaNorth MacedoniaNorthern AfricaNorthern EuropeNorwayOceaniaPakistanPanamaPeruPhilippinesPolandPortugalRomaniaRussiaSaudi ArabiaScotlandSenegalSerbiaSierra LeoneSingaporeSomaliaSouth AfricaSouth AmericaSouth Central AsiaSouth Eastern AsiaSouthern EuropeSpainSri LankaSt. Vincent and the GrenadinesSudanSwedenSwitzerlandSyriaTaiwanThailandTrinidad and TobagoTurkeyUgandaUkraineUruguayUzbekistanVenezuelaVietnamWest IndiesWestern AfricaWestern AsiaWestern EuropeYemenZaireZimbabweAzores
Master's Degree
Income
Poverty
Unemployment
Labor Participation
Family Structure
Vehicle Availability
Education Level
Disability

Master's Degree Comparison

Paraguayans

Spanish Americans

Exceptional
Tragic
18.8%
MASTER'S DEGREE
100.0/ 100
METRIC RATING
48th/ 347
METRIC RANK
13.0%
MASTER'S DEGREE
1.9/ 100
METRIC RATING
242nd/ 347
METRIC RANK

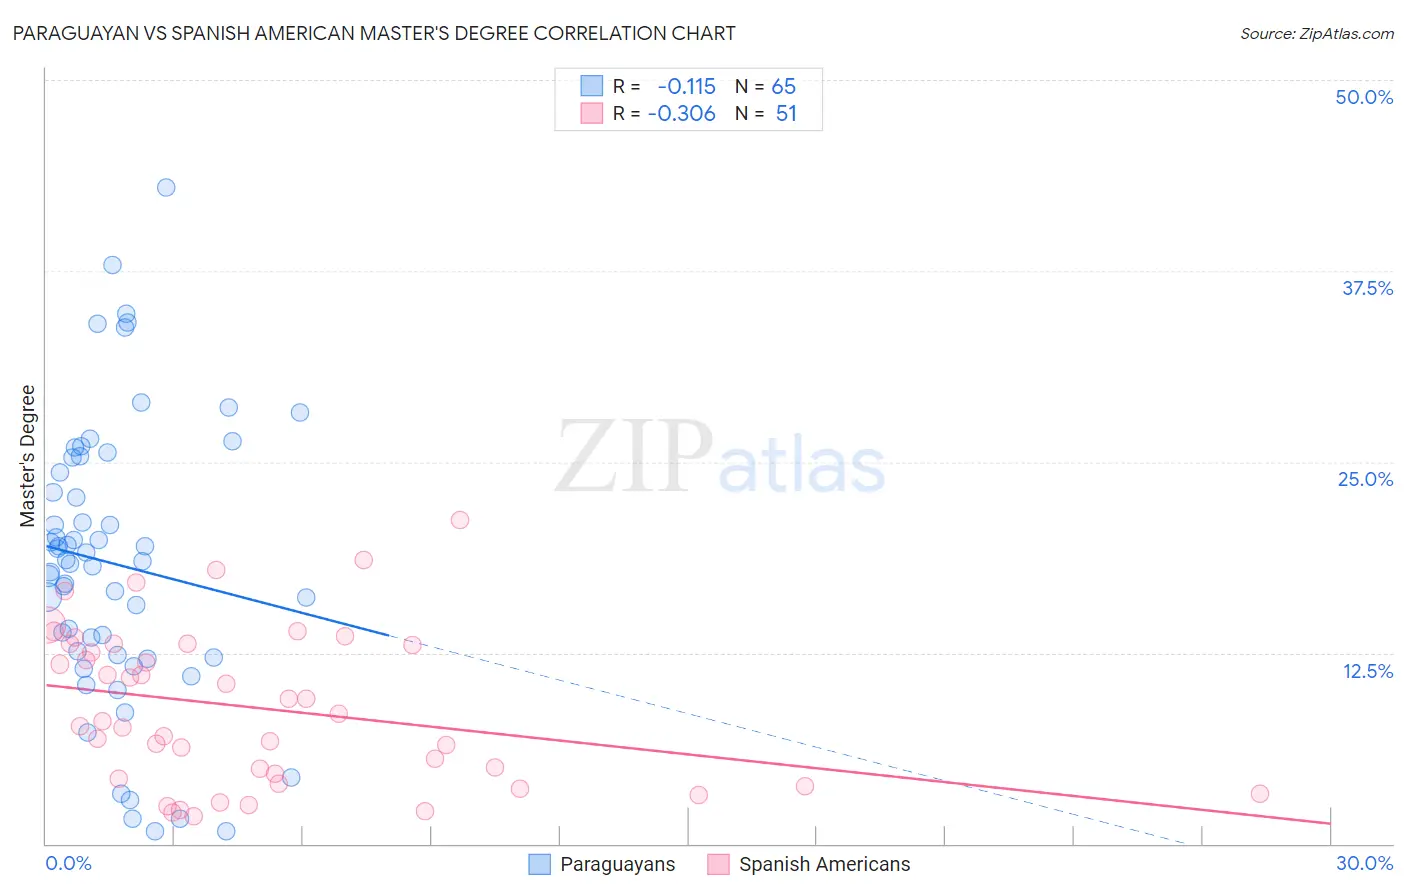
Paraguayan vs Spanish American Master's Degree Correlation Chart

The statistical analysis conducted on geographies consisting of 95,082,006 people shows a poor negative correlation between the proportion of Paraguayans and percentage of population with at least master's degree education in the United States with a correlation coefficient (R) of -0.115 and weighted average of 18.8%. Similarly, the statistical analysis conducted on geographies consisting of 103,160,270 people shows a mild negative correlation between the proportion of Spanish Americans and percentage of population with at least master's degree education in the United States with a correlation coefficient (R) of -0.306 and weighted average of 13.0%, a difference of 44.2%.
Paraguayan vs Spanish American Master's Degree

Master's Degree Correlation Summary

MeasurementParaguayanSpanish American
Minimum0.82%1.8%
Maximum42.9%21.2%
Range42.1%19.4%
Mean18.3%8.9%
Median18.5%8.0%
Interquartile 25% (IQ1)12.3%4.3%
Interquartile 75% (IQ3)24.8%13.1%
Interquartile Range (IQR)12.5%8.8%
Standard Deviation (Sample)9.2%5.0%
Standard Deviation (Population)9.1%5.0%

Similar Demographics by Master's Degree

Demographics Similar to Paraguayans by Master's Degree

In terms of master's degree, the demographic groups most similar to Paraguayans are Immigrants from Austria (18.8%, a difference of 0.060%), Immigrants from Norway (18.8%, a difference of 0.070%), Estonian (18.8%, a difference of 0.10%), Bulgarian (18.8%, a difference of 0.28%), and Immigrants from South Africa (18.8%, a difference of 0.30%).
DemographicsRating | RankMaster's Degree
Immigrants | Latvia
100.0
/100
|
#41
Exceptional
19.1%
Immigrants | Saudi Arabia
100.0
/100
|
#42
Exceptional
19.0%
Immigrants | Greece
100.0
/100
|
#43
Exceptional
19.0%
Immigrants | Malaysia
100.0
/100
|
#44
Exceptional
18.9%
Immigrants | Belarus
100.0
/100
|
#45
Exceptional
18.9%
Immigrants | Norway
100.0
/100
|
#46
Exceptional
18.8%
Immigrants | Austria
100.0
/100
|
#47
Exceptional
18.8%
Paraguayans
100.0
/100
|
#48
Exceptional
18.8%
Estonians
100.0
/100
|
#49
Exceptional
18.8%
Bulgarians
100.0
/100
|
#50
Exceptional
18.8%
Immigrants | South Africa
100.0
/100
|
#51
Exceptional
18.8%
Immigrants | Kuwait
100.0
/100
|
#52
Exceptional
18.6%
Immigrants | Czechoslovakia
99.9
/100
|
#53
Exceptional
18.5%
Immigrants | Lithuania
99.9
/100
|
#54
Exceptional
18.5%
Immigrants | Serbia
99.9
/100
|
#55
Exceptional
18.5%

Demographics Similar to Spanish Americans by Master's Degree

In terms of master's degree, the demographic groups most similar to Spanish Americans are Immigrants from Jamaica (13.0%, a difference of 0.040%), U.S. Virgin Islander (13.1%, a difference of 0.28%), Delaware (13.0%, a difference of 0.42%), Guamanian/Chamorro (13.1%, a difference of 0.43%), and Immigrants from Bahamas (12.9%, a difference of 1.1%).
DemographicsRating | RankMaster's Degree
German Russians
4.5
/100
|
#235
Tragic
13.5%
Immigrants | Guyana
4.4
/100
|
#236
Tragic
13.4%
Jamaicans
4.1
/100
|
#237
Tragic
13.4%
Hmong
4.0
/100
|
#238
Tragic
13.4%
Immigrants | Nonimmigrants
3.4
/100
|
#239
Tragic
13.3%
Guamanians/Chamorros
2.2
/100
|
#240
Tragic
13.1%
U.S. Virgin Islanders
2.1
/100
|
#241
Tragic
13.1%
Spanish Americans
1.9
/100
|
#242
Tragic
13.0%
Immigrants | Jamaica
1.9
/100
|
#243
Tragic
13.0%
Delaware
1.7
/100
|
#244
Tragic
13.0%
Immigrants | Bahamas
1.4
/100
|
#245
Tragic
12.9%
Immigrants | Cambodia
1.4
/100
|
#246
Tragic
12.9%
Iroquois
1.4
/100
|
#247
Tragic
12.9%
Africans
1.4
/100
|
#248
Tragic
12.9%
Cree
1.3
/100
|
#249
Tragic
12.8%