Lumbee vs Immigrants from Argentina 9th Grade
COMPARE
Lumbee
Immigrants from Argentina
9th Grade
9th Grade Comparison
Lumbee
Immigrants from Argentina
94.4%
9TH GRADE
4.7/ 100
METRIC RATING
228th/ 347
METRIC RANK
94.8%
9TH GRADE
34.4/ 100
METRIC RATING
189th/ 347
METRIC RANK
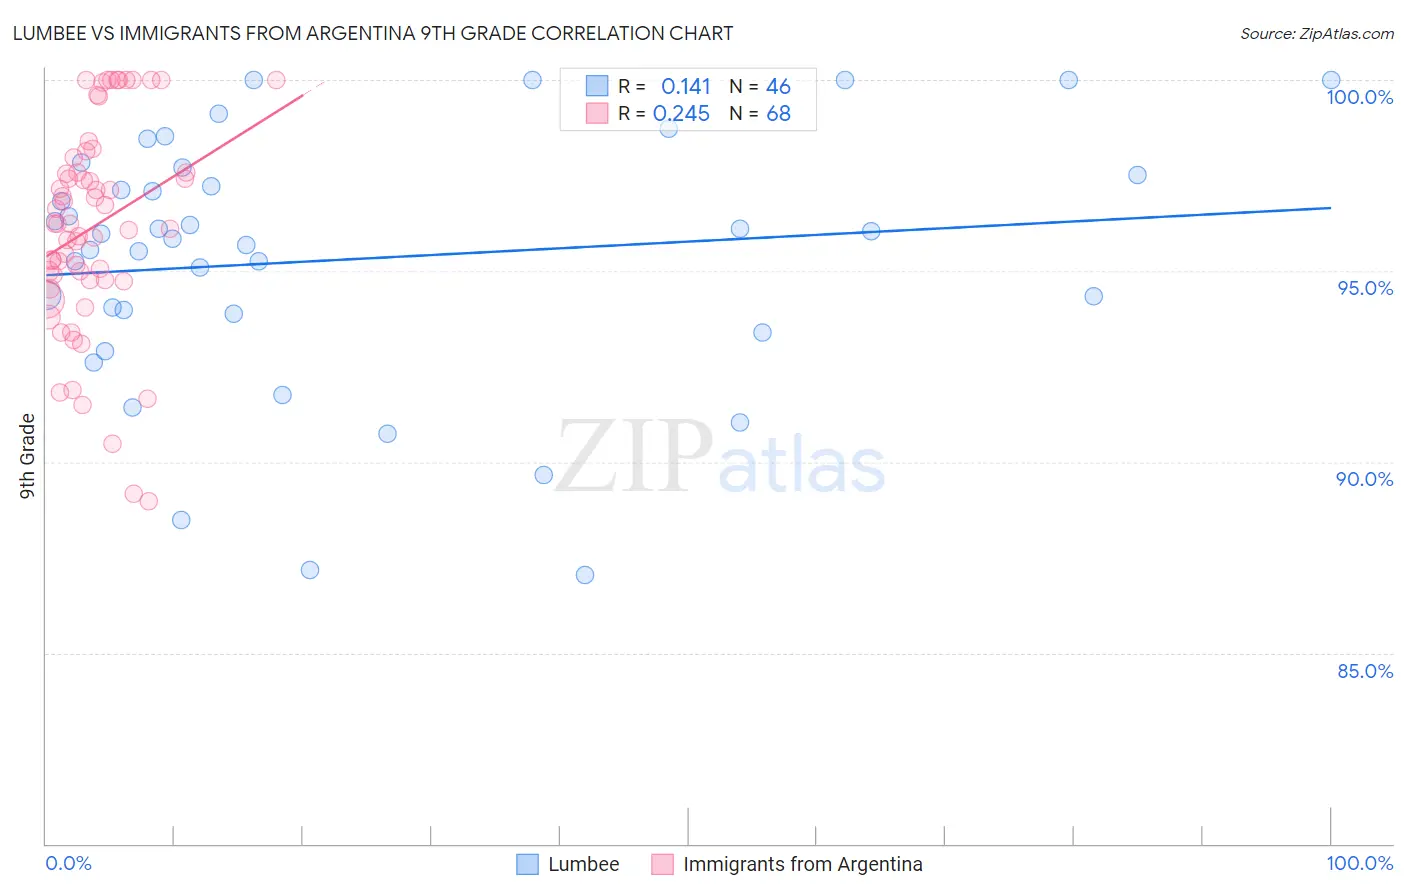
Lumbee vs Immigrants from Argentina 9th Grade Correlation Chart
The statistical analysis conducted on geographies consisting of 92,298,865 people shows a poor positive correlation between the proportion of Lumbee and percentage of population with at least 9th grade education in the United States with a correlation coefficient (R) of 0.141 and weighted average of 94.4%. Similarly, the statistical analysis conducted on geographies consisting of 264,436,618 people shows a weak positive correlation between the proportion of Immigrants from Argentina and percentage of population with at least 9th grade education in the United States with a correlation coefficient (R) of 0.245 and weighted average of 94.8%, a difference of 0.44%.
9th Grade Correlation Summary
| Measurement | Lumbee | Immigrants from Argentina |
| Minimum | 87.0% | 89.0% |
| Maximum | 100.0% | 100.0% |
| Range | 13.0% | 11.0% |
| Mean | 95.3% | 96.2% |
| Median | 95.9% | 96.2% |
| Interquartile 25% (IQ1) | 93.9% | 94.8% |
| Interquartile 75% (IQ3) | 97.5% | 97.8% |
| Interquartile Range (IQR) | 3.6% | 3.0% |
| Standard Deviation (Sample) | 3.3% | 2.7% |
| Standard Deviation (Population) | 3.3% | 2.7% |
Similar Demographics by 9th Grade
Demographics Similar to Lumbee by 9th Grade
In terms of 9th grade, the demographic groups most similar to Lumbee are Immigrants from Sierra Leone (94.4%, a difference of 0.0%), Immigrants from Southern Europe (94.3%, a difference of 0.010%), Apache (94.3%, a difference of 0.020%), Ethiopian (94.4%, a difference of 0.030%), and Subsaharan African (94.4%, a difference of 0.030%).
| Demographics | Rating | Rank | 9th Grade |
| Immigrants | Eastern Africa | 8.2 /100 | #221 | Tragic 94.5% |
| Immigrants | Asia | 7.7 /100 | #222 | Tragic 94.4% |
| Bahamians | 7.0 /100 | #223 | Tragic 94.4% |
| Tongans | 6.0 /100 | #224 | Tragic 94.4% |
| Ethiopians | 5.4 /100 | #225 | Tragic 94.4% |
| Sub-Saharan Africans | 5.4 /100 | #226 | Tragic 94.4% |
| Immigrants | Sierra Leone | 4.8 /100 | #227 | Tragic 94.4% |
| Lumbee | 4.7 /100 | #228 | Tragic 94.4% |
| Immigrants | Southern Europe | 4.5 /100 | #229 | Tragic 94.3% |
| Apache | 4.2 /100 | #230 | Tragic 94.3% |
| Immigrants | Panama | 4.0 /100 | #231 | Tragic 94.3% |
| Immigrants | Africa | 3.9 /100 | #232 | Tragic 94.3% |
| Nigerians | 3.7 /100 | #233 | Tragic 94.3% |
| Costa Ricans | 3.5 /100 | #234 | Tragic 94.3% |
| Bolivians | 3.3 /100 | #235 | Tragic 94.3% |
Demographics Similar to Immigrants from Argentina by 9th Grade
In terms of 9th grade, the demographic groups most similar to Immigrants from Argentina are Immigrants from Albania (94.8%, a difference of 0.0%), Guamanian/Chamorro (94.8%, a difference of 0.010%), Sudanese (94.7%, a difference of 0.010%), Liberian (94.8%, a difference of 0.020%), and Hopi (94.8%, a difference of 0.020%).
| Demographics | Rating | Rank | 9th Grade |
| Seminole | 42.5 /100 | #182 | Average 94.8% |
| Immigrants | Nepal | 39.7 /100 | #183 | Fair 94.8% |
| Argentineans | 37.6 /100 | #184 | Fair 94.8% |
| Liberians | 37.4 /100 | #185 | Fair 94.8% |
| Hopi | 37.1 /100 | #186 | Fair 94.8% |
| Guamanians/Chamorros | 35.5 /100 | #187 | Fair 94.8% |
| Immigrants | Albania | 34.5 /100 | #188 | Fair 94.8% |
| Immigrants | Argentina | 34.4 /100 | #189 | Fair 94.8% |
| Sudanese | 32.7 /100 | #190 | Fair 94.7% |
| Assyrians/Chaldeans/Syriacs | 32.0 /100 | #191 | Fair 94.7% |
| Immigrants | Northern Africa | 30.7 /100 | #192 | Fair 94.7% |
| Paraguayans | 30.1 /100 | #193 | Fair 94.7% |
| Panamanians | 29.0 /100 | #194 | Fair 94.7% |
| Marshallese | 27.9 /100 | #195 | Fair 94.7% |
| Immigrants | Lebanon | 27.2 /100 | #196 | Fair 94.7% |