Immigrants from Belgium vs British West Indian 12th Grade, No Diploma
COMPARE
Immigrants from Belgium
British West Indian
12th Grade, No Diploma
12th Grade, No Diploma Comparison
Immigrants from Belgium
British West Indians
92.9%
12TH GRADE, NO DIPLOMA
99.8/ 100
METRIC RATING
51st/ 347
METRIC RANK
88.5%
12TH GRADE, NO DIPLOMA
0.0/ 100
METRIC RATING
290th/ 347
METRIC RANK
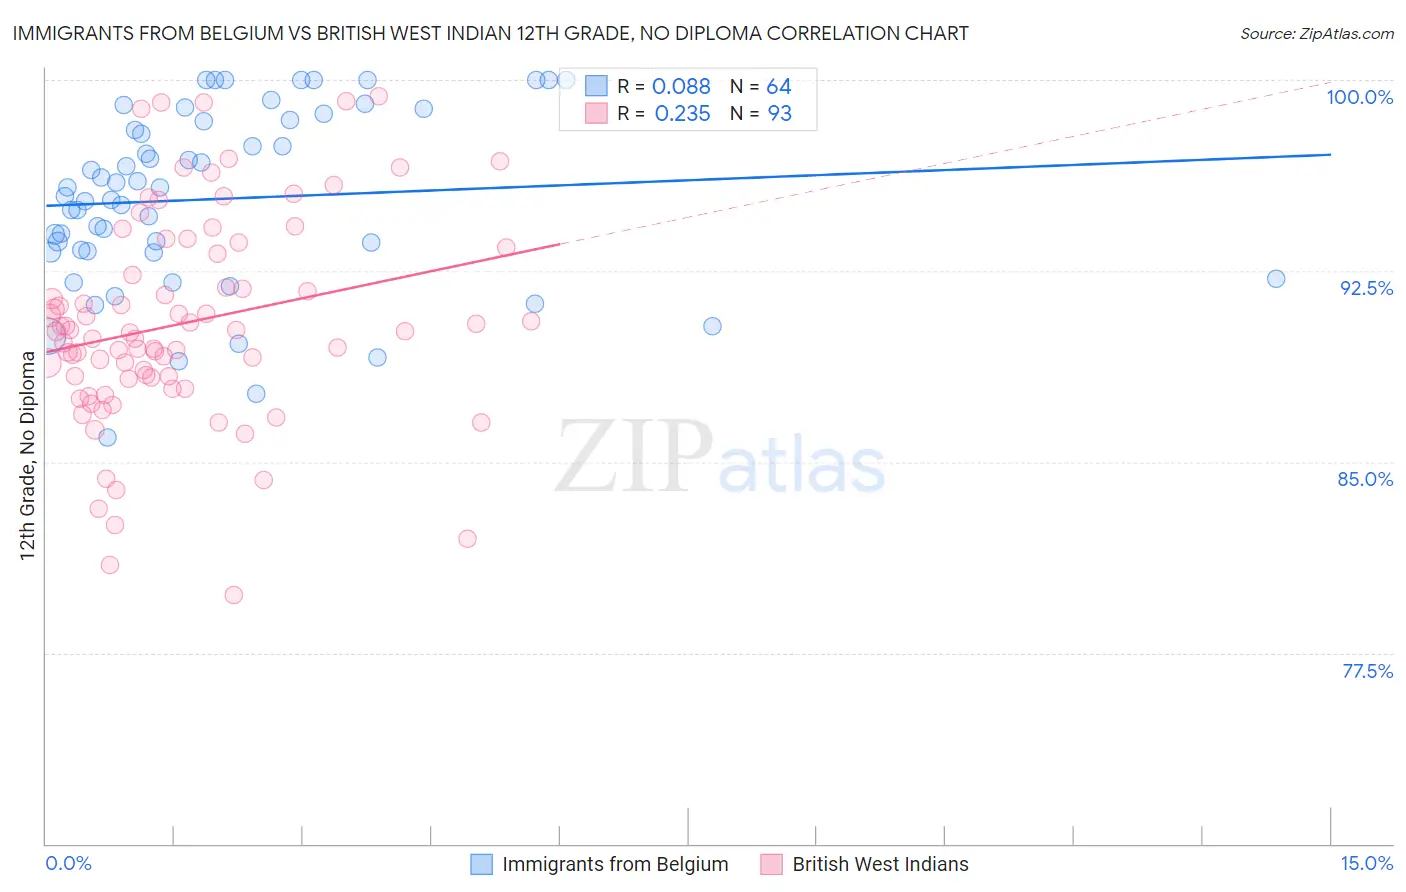
Immigrants from Belgium vs British West Indian 12th Grade, No Diploma Correlation Chart
The statistical analysis conducted on geographies consisting of 146,727,159 people shows a slight positive correlation between the proportion of Immigrants from Belgium and percentage of population with at least 12th grade (no diploma) education in the United States with a correlation coefficient (R) of 0.088 and weighted average of 92.9%. Similarly, the statistical analysis conducted on geographies consisting of 152,698,597 people shows a weak positive correlation between the proportion of British West Indians and percentage of population with at least 12th grade (no diploma) education in the United States with a correlation coefficient (R) of 0.235 and weighted average of 88.5%, a difference of 4.9%.
12th Grade, No Diploma Correlation Summary
| Measurement | Immigrants from Belgium | British West Indian |
| Minimum | 86.0% | 79.8% |
| Maximum | 100.0% | 99.4% |
| Range | 14.0% | 19.6% |
| Mean | 95.3% | 90.5% |
| Median | 95.6% | 90.1% |
| Interquartile 25% (IQ1) | 93.3% | 88.3% |
| Interquartile 75% (IQ3) | 98.4% | 93.3% |
| Interquartile Range (IQR) | 5.2% | 5.0% |
| Standard Deviation (Sample) | 3.5% | 4.1% |
| Standard Deviation (Population) | 3.5% | 4.1% |
Similar Demographics by 12th Grade, No Diploma
Demographics Similar to Immigrants from Belgium by 12th Grade, No Diploma
In terms of 12th grade, no diploma, the demographic groups most similar to Immigrants from Belgium are Tsimshian (92.9%, a difference of 0.0%), Macedonian (92.9%, a difference of 0.010%), Immigrants from Sweden (92.8%, a difference of 0.010%), Australian (92.9%, a difference of 0.030%), and Serbian (92.8%, a difference of 0.030%).
| Demographics | Rating | Rank | 12th Grade, No Diploma |
| Dutch | 99.8 /100 | #44 | Exceptional 92.9% |
| Greeks | 99.8 /100 | #45 | Exceptional 92.9% |
| British | 99.8 /100 | #46 | Exceptional 92.9% |
| Belgians | 99.8 /100 | #47 | Exceptional 92.9% |
| Australians | 99.8 /100 | #48 | Exceptional 92.9% |
| Macedonians | 99.8 /100 | #49 | Exceptional 92.9% |
| Tsimshian | 99.8 /100 | #50 | Exceptional 92.9% |
| Immigrants | Belgium | 99.8 /100 | #51 | Exceptional 92.9% |
| Immigrants | Sweden | 99.8 /100 | #52 | Exceptional 92.8% |
| Serbians | 99.7 /100 | #53 | Exceptional 92.8% |
| Hungarians | 99.7 /100 | #54 | Exceptional 92.8% |
| Welsh | 99.7 /100 | #55 | Exceptional 92.8% |
| New Zealanders | 99.7 /100 | #56 | Exceptional 92.8% |
| Immigrants | Canada | 99.7 /100 | #57 | Exceptional 92.8% |
| Immigrants | Taiwan | 99.7 /100 | #58 | Exceptional 92.8% |
Demographics Similar to British West Indians by 12th Grade, No Diploma
In terms of 12th grade, no diploma, the demographic groups most similar to British West Indians are Dutch West Indian (88.5%, a difference of 0.0%), Haitian (88.5%, a difference of 0.0%), Immigrants from Fiji (88.6%, a difference of 0.10%), Hopi (88.6%, a difference of 0.11%), and Indonesian (88.6%, a difference of 0.12%).
| Demographics | Rating | Rank | 12th Grade, No Diploma |
| Paiute | 0.0 /100 | #283 | Tragic 88.7% |
| Pennsylvania Germans | 0.0 /100 | #284 | Tragic 88.7% |
| Indonesians | 0.0 /100 | #285 | Tragic 88.6% |
| Immigrants | West Indies | 0.0 /100 | #286 | Tragic 88.6% |
| Hopi | 0.0 /100 | #287 | Tragic 88.6% |
| Immigrants | Fiji | 0.0 /100 | #288 | Tragic 88.6% |
| Dutch West Indians | 0.0 /100 | #289 | Tragic 88.5% |
| British West Indians | 0.0 /100 | #290 | Tragic 88.5% |
| Haitians | 0.0 /100 | #291 | Tragic 88.5% |
| Immigrants | Grenada | 0.0 /100 | #292 | Tragic 88.4% |
| Japanese | 0.0 /100 | #293 | Tragic 88.3% |
| Guyanese | 0.0 /100 | #294 | Tragic 88.3% |
| Immigrants | Immigrants | 0.0 /100 | #295 | Tragic 88.2% |
| Fijians | 0.0 /100 | #296 | Tragic 88.2% |
| Pueblo | 0.0 /100 | #297 | Tragic 88.2% |