Lithuanian vs Jordanian 9th Grade
COMPARE
Lithuanian
Jordanian
9th Grade
9th Grade Comparison
Lithuanians
Jordanians
96.6%
9TH GRADE
100.0/ 100
METRIC RATING
10th/ 347
METRIC RANK
95.3%
9TH GRADE
93.5/ 100
METRIC RATING
130th/ 347
METRIC RANK
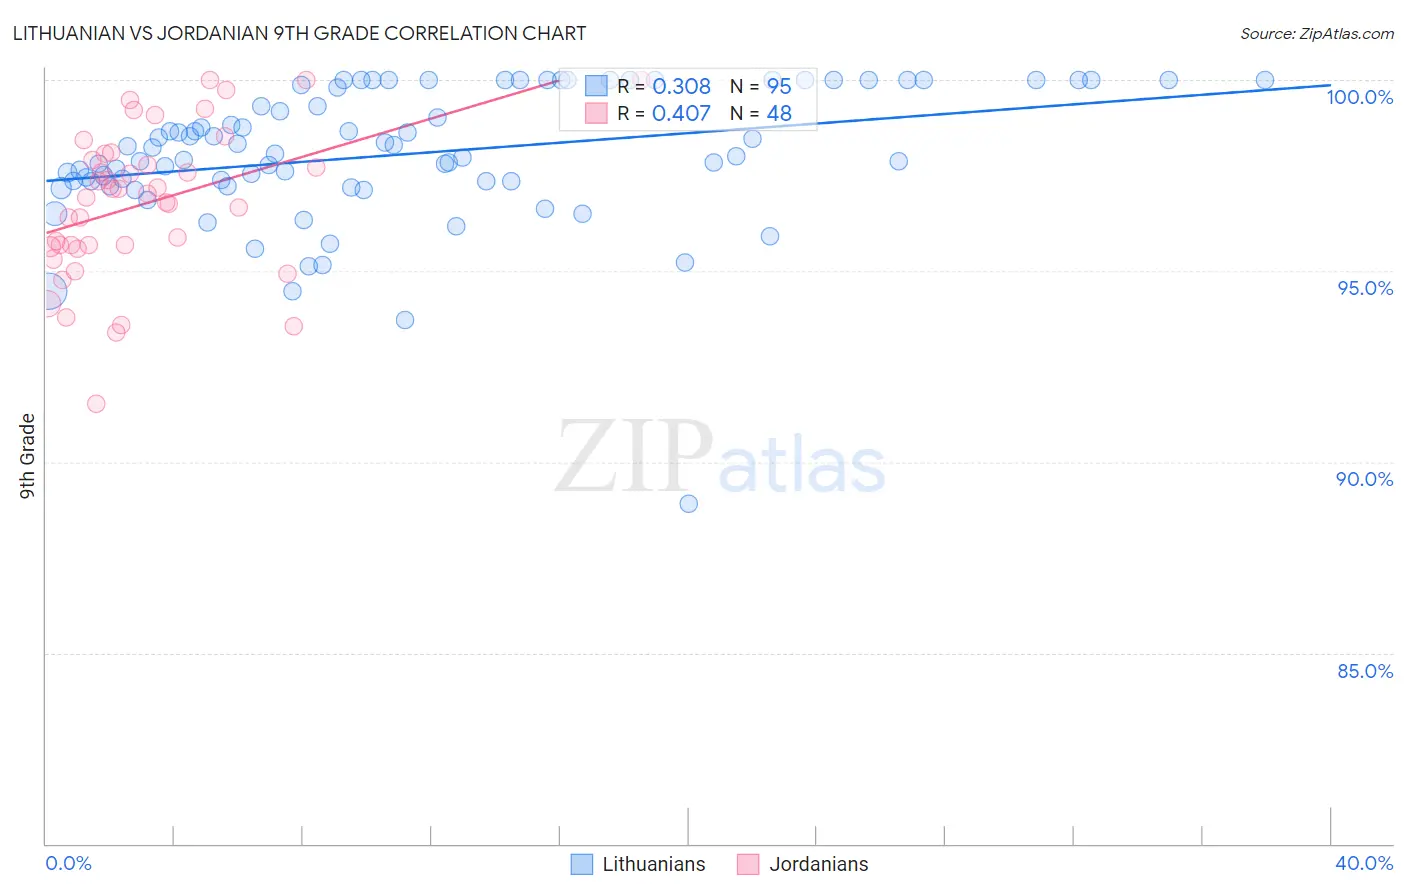
Lithuanian vs Jordanian 9th Grade Correlation Chart
The statistical analysis conducted on geographies consisting of 421,947,524 people shows a mild positive correlation between the proportion of Lithuanians and percentage of population with at least 9th grade education in the United States with a correlation coefficient (R) of 0.308 and weighted average of 96.6%. Similarly, the statistical analysis conducted on geographies consisting of 166,403,553 people shows a moderate positive correlation between the proportion of Jordanians and percentage of population with at least 9th grade education in the United States with a correlation coefficient (R) of 0.407 and weighted average of 95.3%, a difference of 1.3%.
9th Grade Correlation Summary
| Measurement | Lithuanian | Jordanian |
| Minimum | 88.9% | 91.5% |
| Maximum | 100.0% | 100.0% |
| Range | 11.1% | 8.5% |
| Mean | 98.1% | 96.8% |
| Median | 98.1% | 97.0% |
| Interquartile 25% (IQ1) | 97.3% | 95.7% |
| Interquartile 75% (IQ3) | 100.0% | 98.0% |
| Interquartile Range (IQR) | 2.7% | 2.3% |
| Standard Deviation (Sample) | 1.8% | 1.9% |
| Standard Deviation (Population) | 1.8% | 1.9% |
Similar Demographics by 9th Grade
Demographics Similar to Lithuanians by 9th Grade
In terms of 9th grade, the demographic groups most similar to Lithuanians are Finnish (96.6%, a difference of 0.0%), English (96.6%, a difference of 0.020%), Tlingit-Haida (96.6%, a difference of 0.040%), Danish (96.5%, a difference of 0.070%), and Scottish (96.5%, a difference of 0.070%).
| Demographics | Rating | Rank | 9th Grade |
| Slovaks | 100.0 /100 | #3 | Exceptional 96.9% |
| Slovenes | 100.0 /100 | #4 | Exceptional 96.7% |
| Swedes | 100.0 /100 | #5 | Exceptional 96.7% |
| Poles | 100.0 /100 | #6 | Exceptional 96.7% |
| Carpatho Rusyns | 100.0 /100 | #7 | Exceptional 96.7% |
| Germans | 100.0 /100 | #8 | Exceptional 96.7% |
| Tlingit-Haida | 100.0 /100 | #9 | Exceptional 96.6% |
| Lithuanians | 100.0 /100 | #10 | Exceptional 96.6% |
| Finns | 100.0 /100 | #11 | Exceptional 96.6% |
| English | 100.0 /100 | #12 | Exceptional 96.6% |
| Danes | 100.0 /100 | #13 | Exceptional 96.5% |
| Scottish | 100.0 /100 | #14 | Exceptional 96.5% |
| Irish | 100.0 /100 | #15 | Exceptional 96.5% |
| Croatians | 100.0 /100 | #16 | Exceptional 96.5% |
| Dutch | 100.0 /100 | #17 | Exceptional 96.5% |
Demographics Similar to Jordanians by 9th Grade
In terms of 9th grade, the demographic groups most similar to Jordanians are Palestinian (95.4%, a difference of 0.020%), Immigrants from Hungary (95.4%, a difference of 0.020%), Basque (95.4%, a difference of 0.020%), Immigrants from Serbia (95.4%, a difference of 0.030%), and Immigrants from North Macedonia (95.3%, a difference of 0.030%).
| Demographics | Rating | Rank | 9th Grade |
| Kiowa | 95.3 /100 | #123 | Exceptional 95.4% |
| Shoshone | 95.3 /100 | #124 | Exceptional 95.4% |
| Immigrants | South Central Asia | 95.1 /100 | #125 | Exceptional 95.4% |
| Immigrants | Serbia | 94.4 /100 | #126 | Exceptional 95.4% |
| Palestinians | 94.3 /100 | #127 | Exceptional 95.4% |
| Immigrants | Hungary | 94.2 /100 | #128 | Exceptional 95.4% |
| Basques | 94.1 /100 | #129 | Exceptional 95.4% |
| Jordanians | 93.5 /100 | #130 | Exceptional 95.3% |
| Immigrants | North Macedonia | 92.3 /100 | #131 | Exceptional 95.3% |
| Immigrants | Nonimmigrants | 92.0 /100 | #132 | Exceptional 95.3% |
| Israelis | 90.4 /100 | #133 | Exceptional 95.3% |
| Immigrants | Israel | 89.6 /100 | #134 | Excellent 95.3% |
| Immigrants | Belarus | 88.9 /100 | #135 | Excellent 95.2% |
| Immigrants | Iran | 88.3 /100 | #136 | Excellent 95.2% |
| Hmong | 87.7 /100 | #137 | Excellent 95.2% |