Immigrants from Kuwait vs Ute 6th Grade
COMPARE
Immigrants from Kuwait
Ute
6th Grade
6th Grade Comparison
Immigrants from Kuwait
Ute
97.3%
6TH GRADE
89.5/ 100
METRIC RATING
134th/ 347
METRIC RANK
97.1%
6TH GRADE
71.1/ 100
METRIC RATING
155th/ 347
METRIC RANK
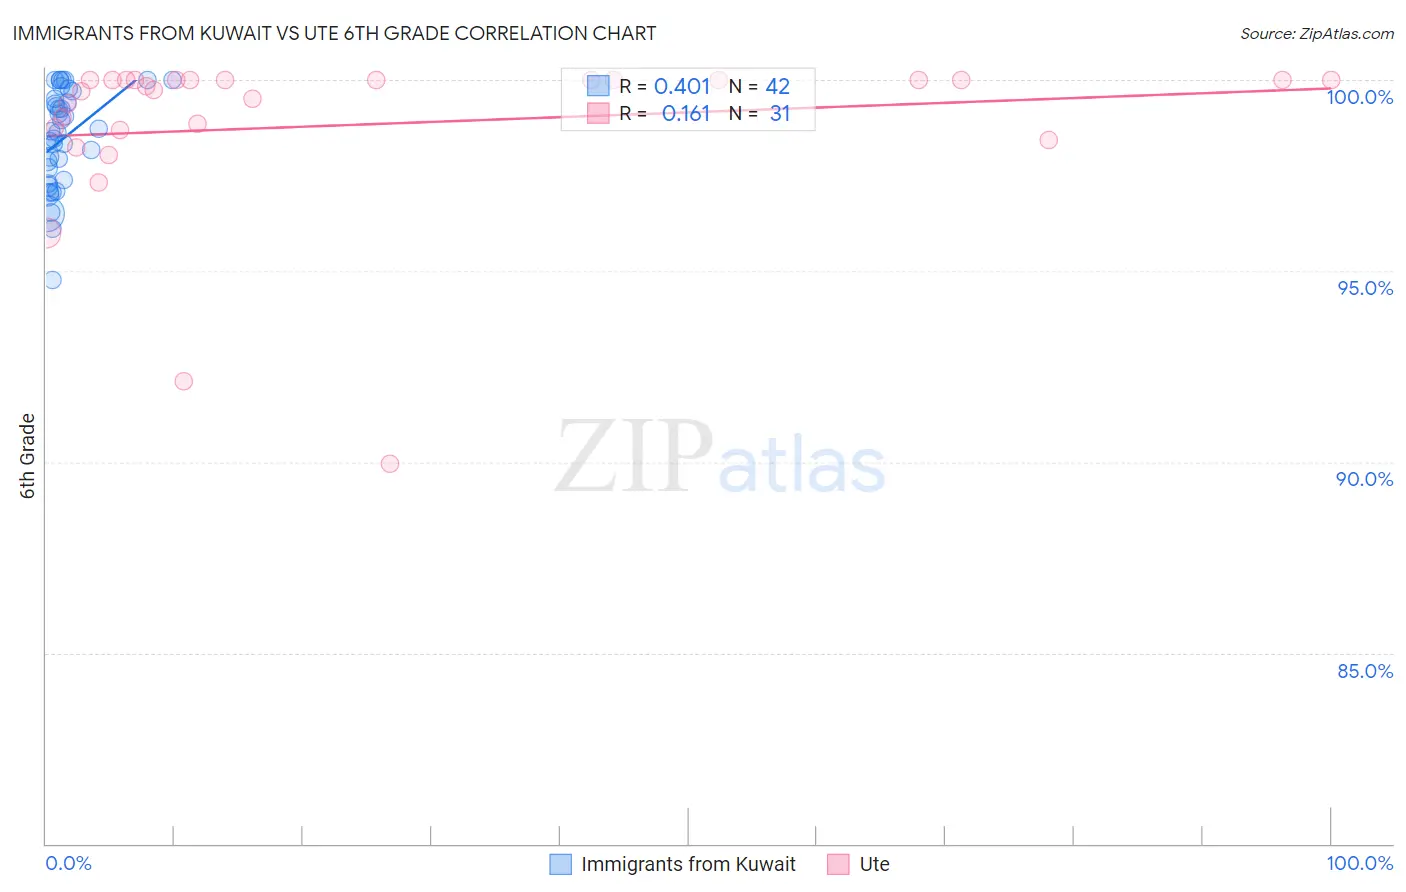
Immigrants from Kuwait vs Ute 6th Grade Correlation Chart
The statistical analysis conducted on geographies consisting of 136,913,666 people shows a moderate positive correlation between the proportion of Immigrants from Kuwait and percentage of population with at least 6th grade education in the United States with a correlation coefficient (R) of 0.401 and weighted average of 97.3%. Similarly, the statistical analysis conducted on geographies consisting of 55,668,539 people shows a poor positive correlation between the proportion of Ute and percentage of population with at least 6th grade education in the United States with a correlation coefficient (R) of 0.161 and weighted average of 97.1%, a difference of 0.14%.
6th Grade Correlation Summary
| Measurement | Immigrants from Kuwait | Ute |
| Minimum | 94.8% | 89.9% |
| Maximum | 100.0% | 100.0% |
| Range | 5.2% | 10.1% |
| Mean | 98.5% | 98.8% |
| Median | 98.6% | 99.8% |
| Interquartile 25% (IQ1) | 97.4% | 98.7% |
| Interquartile 75% (IQ3) | 99.5% | 100.0% |
| Interquartile Range (IQR) | 2.1% | 1.3% |
| Standard Deviation (Sample) | 1.3% | 2.3% |
| Standard Deviation (Population) | 1.3% | 2.3% |
Similar Demographics by 6th Grade
Demographics Similar to Immigrants from Kuwait by 6th Grade
In terms of 6th grade, the demographic groups most similar to Immigrants from Kuwait are Immigrants from Hungary (97.3%, a difference of 0.0%), Immigrants from Moldova (97.3%, a difference of 0.010%), Filipino (97.3%, a difference of 0.010%), Immigrants from Europe (97.3%, a difference of 0.020%), and Palestinian (97.3%, a difference of 0.020%).
| Demographics | Rating | Rank | 6th Grade |
| Immigrants | Croatia | 93.1 /100 | #127 | Exceptional 97.3% |
| Immigrants | Romania | 92.0 /100 | #128 | Exceptional 97.3% |
| Immigrants | Serbia | 91.9 /100 | #129 | Exceptional 97.3% |
| Cambodians | 91.8 /100 | #130 | Exceptional 97.3% |
| Immigrants | Europe | 91.1 /100 | #131 | Exceptional 97.3% |
| Palestinians | 90.9 /100 | #132 | Exceptional 97.3% |
| Immigrants | Moldova | 90.0 /100 | #133 | Excellent 97.3% |
| Immigrants | Kuwait | 89.5 /100 | #134 | Excellent 97.3% |
| Immigrants | Hungary | 89.5 /100 | #135 | Excellent 97.3% |
| Filipinos | 88.9 /100 | #136 | Excellent 97.3% |
| Burmese | 87.8 /100 | #137 | Excellent 97.3% |
| Blackfeet | 87.7 /100 | #138 | Excellent 97.3% |
| Immigrants | Turkey | 86.1 /100 | #139 | Excellent 97.3% |
| Immigrants | North Macedonia | 85.5 /100 | #140 | Excellent 97.2% |
| Seminole | 84.8 /100 | #141 | Excellent 97.2% |
Demographics Similar to Ute by 6th Grade
In terms of 6th grade, the demographic groups most similar to Ute are Soviet Union (97.2%, a difference of 0.0%), Immigrants from Jordan (97.2%, a difference of 0.010%), Immigrants from Eastern Europe (97.2%, a difference of 0.010%), Alsatian (97.1%, a difference of 0.010%), and Immigrants from Bosnia and Herzegovina (97.2%, a difference of 0.020%).
| Demographics | Rating | Rank | 6th Grade |
| Immigrants | Greece | 77.8 /100 | #148 | Good 97.2% |
| Immigrants | Israel | 76.0 /100 | #149 | Good 97.2% |
| Immigrants | Bosnia and Herzegovina | 74.8 /100 | #150 | Good 97.2% |
| French American Indians | 74.0 /100 | #151 | Good 97.2% |
| Immigrants | Jordan | 73.0 /100 | #152 | Good 97.2% |
| Immigrants | Eastern Europe | 72.6 /100 | #153 | Good 97.2% |
| Soviet Union | 71.5 /100 | #154 | Good 97.2% |
| Ute | 71.1 /100 | #155 | Good 97.1% |
| Alsatians | 69.8 /100 | #156 | Good 97.1% |
| Immigrants | Russia | 67.6 /100 | #157 | Good 97.1% |
| Immigrants | Iran | 63.3 /100 | #158 | Good 97.1% |
| Kenyans | 62.9 /100 | #159 | Good 97.1% |
| Ugandans | 62.2 /100 | #160 | Good 97.1% |
| Immigrants | Belarus | 60.4 /100 | #161 | Good 97.1% |
| Marshallese | 60.2 /100 | #162 | Good 97.1% |