Liberian vs Immigrants from Egypt Master's Degree
COMPARE
Liberian
Immigrants from Egypt
Master's Degree
Master's Degree Comparison
Liberians
Immigrants from Egypt
12.8%
MASTER'S DEGREE
1.3/ 100
METRIC RATING
250th/ 347
METRIC RANK
17.2%
MASTER'S DEGREE
99.1/ 100
METRIC RATING
90th/ 347
METRIC RANK
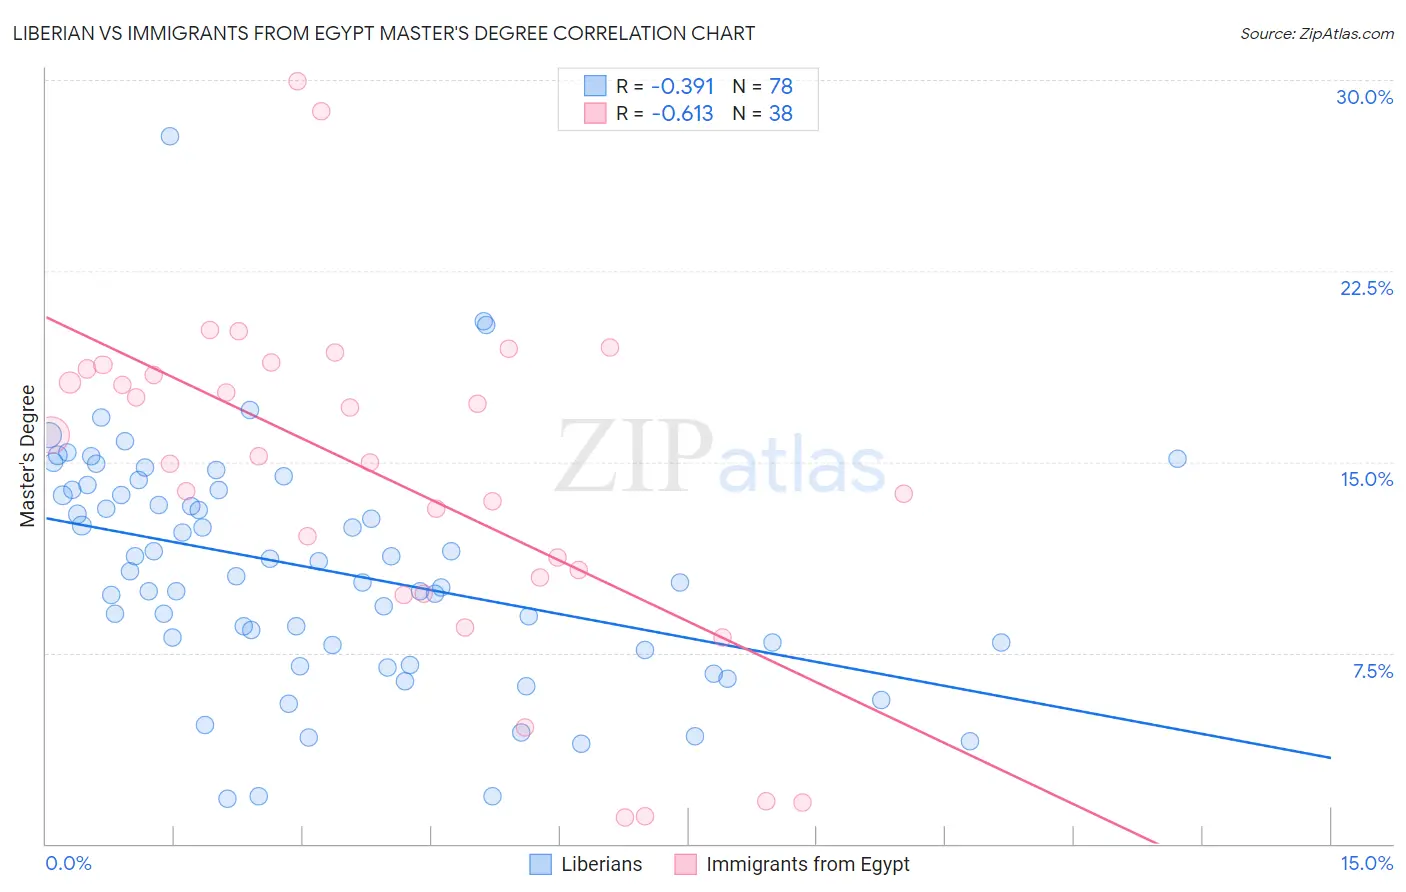
Liberian vs Immigrants from Egypt Master's Degree Correlation Chart
The statistical analysis conducted on geographies consisting of 118,041,824 people shows a mild negative correlation between the proportion of Liberians and percentage of population with at least master's degree education in the United States with a correlation coefficient (R) of -0.391 and weighted average of 12.8%. Similarly, the statistical analysis conducted on geographies consisting of 245,464,462 people shows a significant negative correlation between the proportion of Immigrants from Egypt and percentage of population with at least master's degree education in the United States with a correlation coefficient (R) of -0.613 and weighted average of 17.2%, a difference of 33.8%.
Master's Degree Correlation Summary
| Measurement | Liberian | Immigrants from Egypt |
| Minimum | 1.7% | 1.0% |
| Maximum | 27.8% | 29.9% |
| Range | 26.0% | 28.9% |
| Mean | 10.8% | 14.3% |
| Median | 10.6% | 15.1% |
| Interquartile 25% (IQ1) | 7.8% | 10.4% |
| Interquartile 75% (IQ3) | 13.9% | 18.7% |
| Interquartile Range (IQR) | 6.1% | 8.2% |
| Standard Deviation (Sample) | 4.6% | 6.7% |
| Standard Deviation (Population) | 4.5% | 6.6% |
Similar Demographics by Master's Degree
Demographics Similar to Liberians by Master's Degree
In terms of master's degree, the demographic groups most similar to Liberians are Cree (12.8%, a difference of 0.010%), Tlingit-Haida (12.8%, a difference of 0.030%), African (12.9%, a difference of 0.32%), Iroquois (12.9%, a difference of 0.40%), and Immigrants from Cambodia (12.9%, a difference of 0.44%).
| Demographics | Rating | Rank | Master's Degree |
| Immigrants | Jamaica | 1.9 /100 | #243 | Tragic 13.0% |
| Delaware | 1.7 /100 | #244 | Tragic 13.0% |
| Immigrants | Bahamas | 1.4 /100 | #245 | Tragic 12.9% |
| Immigrants | Cambodia | 1.4 /100 | #246 | Tragic 12.9% |
| Iroquois | 1.4 /100 | #247 | Tragic 12.9% |
| Africans | 1.4 /100 | #248 | Tragic 12.9% |
| Cree | 1.3 /100 | #249 | Tragic 12.8% |
| Liberians | 1.3 /100 | #250 | Tragic 12.8% |
| Tlingit-Haida | 1.3 /100 | #251 | Tragic 12.8% |
| French American Indians | 1.0 /100 | #252 | Tragic 12.7% |
| Immigrants | Dominica | 0.8 /100 | #253 | Tragic 12.6% |
| Indonesians | 0.8 /100 | #254 | Tragic 12.6% |
| Immigrants | Congo | 0.8 /100 | #255 | Tragic 12.6% |
| Immigrants | Portugal | 0.8 /100 | #256 | Tragic 12.6% |
| Osage | 0.7 /100 | #257 | Tragic 12.6% |
Demographics Similar to Immigrants from Egypt by Master's Degree
In terms of master's degree, the demographic groups most similar to Immigrants from Egypt are Bhutanese (17.2%, a difference of 0.020%), Romanian (17.2%, a difference of 0.070%), Immigrants from Canada (17.2%, a difference of 0.090%), Immigrants from North America (17.2%, a difference of 0.12%), and Immigrants from Italy (17.2%, a difference of 0.18%).
| Demographics | Rating | Rank | Master's Degree |
| Immigrants | Zimbabwe | 99.5 /100 | #83 | Exceptional 17.4% |
| Immigrants | Scotland | 99.4 /100 | #84 | Exceptional 17.4% |
| Immigrants | Brazil | 99.4 /100 | #85 | Exceptional 17.4% |
| Immigrants | Croatia | 99.3 /100 | #86 | Exceptional 17.3% |
| Maltese | 99.3 /100 | #87 | Exceptional 17.3% |
| Immigrants | Canada | 99.2 /100 | #88 | Exceptional 17.2% |
| Bhutanese | 99.1 /100 | #89 | Exceptional 17.2% |
| Immigrants | Egypt | 99.1 /100 | #90 | Exceptional 17.2% |
| Romanians | 99.1 /100 | #91 | Exceptional 17.2% |
| Immigrants | North America | 99.1 /100 | #92 | Exceptional 17.2% |
| Immigrants | Italy | 99.1 /100 | #93 | Exceptional 17.2% |
| Ugandans | 99.0 /100 | #94 | Exceptional 17.1% |
| Immigrants | Morocco | 98.9 /100 | #95 | Exceptional 17.1% |
| Immigrants | Northern Africa | 98.9 /100 | #96 | Exceptional 17.1% |
| Immigrants | England | 98.8 /100 | #97 | Exceptional 17.0% |