Liberian vs Immigrants from Singapore Master's Degree
COMPARE
Liberian
Immigrants from Singapore
Master's Degree
Master's Degree Comparison
Liberians
Immigrants from Singapore
12.8%
MASTER'S DEGREE
1.3/ 100
METRIC RATING
250th/ 347
METRIC RANK
23.4%
MASTER'S DEGREE
100.0/ 100
METRIC RATING
1st/ 347
METRIC RANK
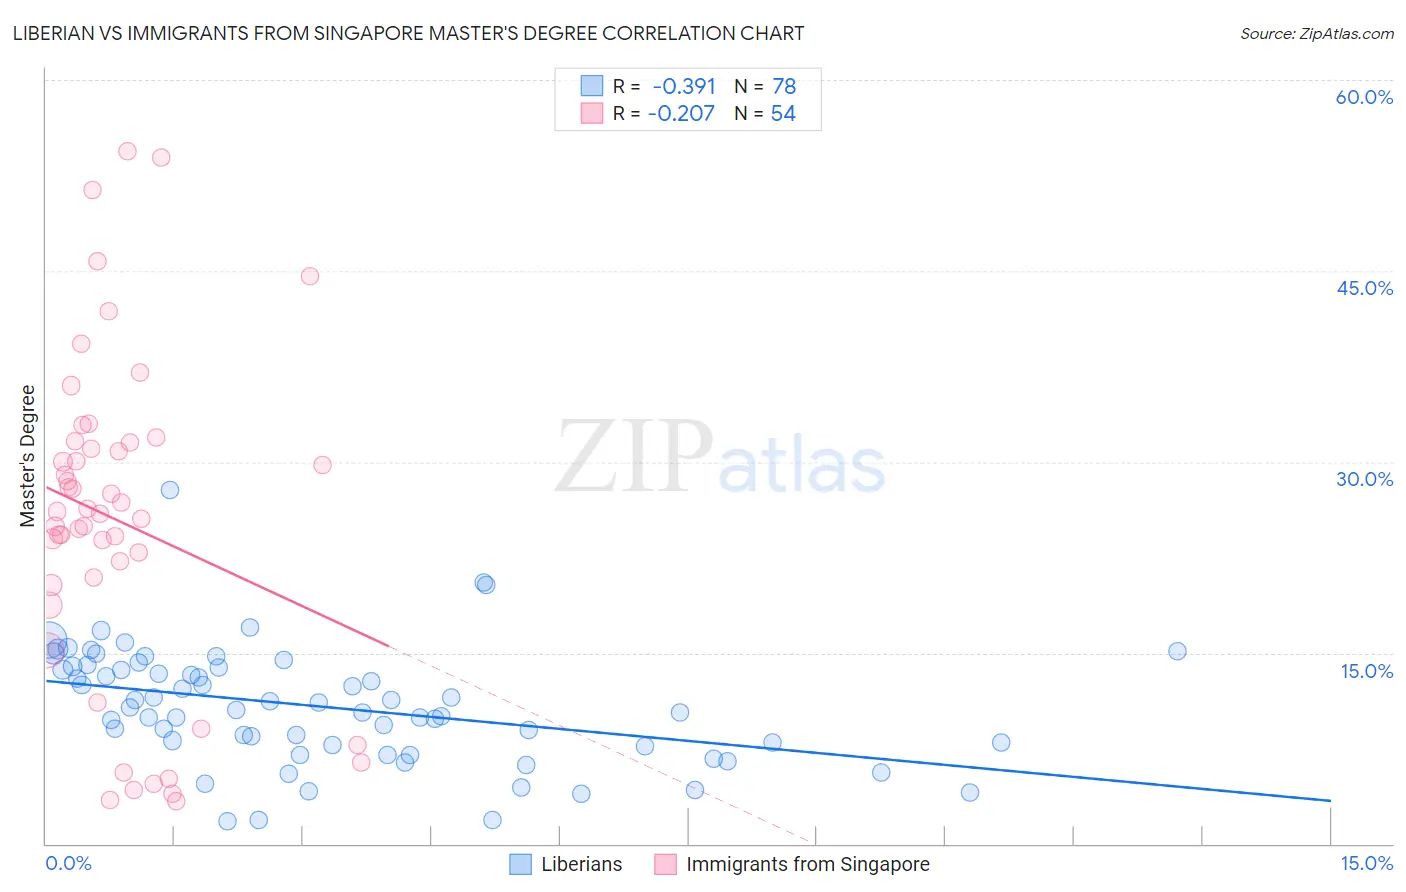
Liberian vs Immigrants from Singapore Master's Degree Correlation Chart
The statistical analysis conducted on geographies consisting of 118,041,824 people shows a mild negative correlation between the proportion of Liberians and percentage of population with at least master's degree education in the United States with a correlation coefficient (R) of -0.391 and weighted average of 12.8%. Similarly, the statistical analysis conducted on geographies consisting of 137,491,179 people shows a weak negative correlation between the proportion of Immigrants from Singapore and percentage of population with at least master's degree education in the United States with a correlation coefficient (R) of -0.207 and weighted average of 23.4%, a difference of 82.3%.
Master's Degree Correlation Summary
| Measurement | Liberian | Immigrants from Singapore |
| Minimum | 1.7% | 3.3% |
| Maximum | 27.8% | 54.4% |
| Range | 26.0% | 51.1% |
| Mean | 10.8% | 25.3% |
| Median | 10.6% | 26.0% |
| Interquartile 25% (IQ1) | 7.8% | 20.4% |
| Interquartile 75% (IQ3) | 13.9% | 31.5% |
| Interquartile Range (IQR) | 6.1% | 11.2% |
| Standard Deviation (Sample) | 4.6% | 12.8% |
| Standard Deviation (Population) | 4.5% | 12.7% |
Similar Demographics by Master's Degree
Demographics Similar to Liberians by Master's Degree
In terms of master's degree, the demographic groups most similar to Liberians are Cree (12.8%, a difference of 0.010%), Tlingit-Haida (12.8%, a difference of 0.030%), African (12.9%, a difference of 0.32%), Iroquois (12.9%, a difference of 0.40%), and Immigrants from Cambodia (12.9%, a difference of 0.44%).
| Demographics | Rating | Rank | Master's Degree |
| Immigrants | Jamaica | 1.9 /100 | #243 | Tragic 13.0% |
| Delaware | 1.7 /100 | #244 | Tragic 13.0% |
| Immigrants | Bahamas | 1.4 /100 | #245 | Tragic 12.9% |
| Immigrants | Cambodia | 1.4 /100 | #246 | Tragic 12.9% |
| Iroquois | 1.4 /100 | #247 | Tragic 12.9% |
| Africans | 1.4 /100 | #248 | Tragic 12.9% |
| Cree | 1.3 /100 | #249 | Tragic 12.8% |
| Liberians | 1.3 /100 | #250 | Tragic 12.8% |
| Tlingit-Haida | 1.3 /100 | #251 | Tragic 12.8% |
| French American Indians | 1.0 /100 | #252 | Tragic 12.7% |
| Immigrants | Dominica | 0.8 /100 | #253 | Tragic 12.6% |
| Indonesians | 0.8 /100 | #254 | Tragic 12.6% |
| Immigrants | Congo | 0.8 /100 | #255 | Tragic 12.6% |
| Immigrants | Portugal | 0.8 /100 | #256 | Tragic 12.6% |
| Osage | 0.7 /100 | #257 | Tragic 12.6% |
Demographics Similar to Immigrants from Singapore by Master's Degree
In terms of master's degree, the demographic groups most similar to Immigrants from Singapore are Filipino (23.4%, a difference of 0.050%), Immigrants from Israel (22.6%, a difference of 3.4%), Okinawan (22.6%, a difference of 3.4%), Immigrants from Taiwan (22.5%, a difference of 4.3%), and Immigrants from India (22.3%, a difference of 5.0%).
| Demographics | Rating | Rank | Master's Degree |
| Immigrants | Singapore | 100.0 /100 | #1 | Exceptional 23.4% |
| Filipinos | 100.0 /100 | #2 | Exceptional 23.4% |
| Immigrants | Israel | 100.0 /100 | #3 | Exceptional 22.6% |
| Okinawans | 100.0 /100 | #4 | Exceptional 22.6% |
| Immigrants | Taiwan | 100.0 /100 | #5 | Exceptional 22.5% |
| Immigrants | India | 100.0 /100 | #6 | Exceptional 22.3% |
| Iranians | 100.0 /100 | #7 | Exceptional 22.3% |
| Cypriots | 100.0 /100 | #8 | Exceptional 21.8% |
| Thais | 100.0 /100 | #9 | Exceptional 21.7% |
| Immigrants | Iran | 100.0 /100 | #10 | Exceptional 21.6% |
| Immigrants | China | 100.0 /100 | #11 | Exceptional 21.2% |
| Eastern Europeans | 100.0 /100 | #12 | Exceptional 21.1% |
| Immigrants | Australia | 100.0 /100 | #13 | Exceptional 20.9% |
| Immigrants | Switzerland | 100.0 /100 | #14 | Exceptional 20.9% |
| Immigrants | Eastern Asia | 100.0 /100 | #15 | Exceptional 20.8% |