Immigrants from Netherlands vs Czech 9th Grade
COMPARE
Immigrants from Netherlands
Czech
9th Grade
9th Grade Comparison
Immigrants from Netherlands
Czechs
95.8%
9TH GRADE
99.6/ 100
METRIC RATING
66th/ 347
METRIC RANK
96.4%
9TH GRADE
100.0/ 100
METRIC RATING
23rd/ 347
METRIC RANK
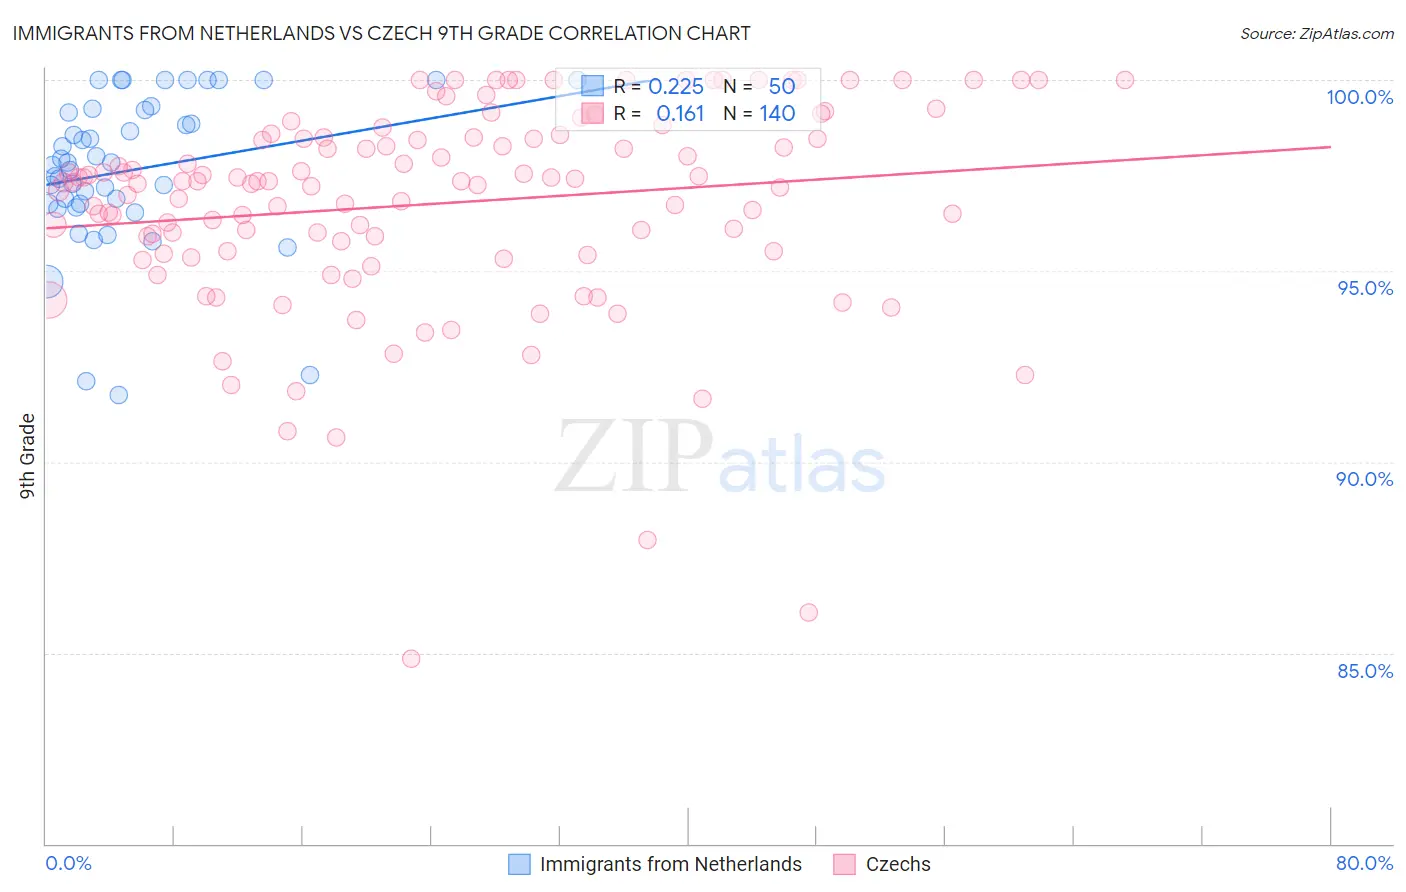
Immigrants from Netherlands vs Czech 9th Grade Correlation Chart
The statistical analysis conducted on geographies consisting of 237,869,934 people shows a weak positive correlation between the proportion of Immigrants from Netherlands and percentage of population with at least 9th grade education in the United States with a correlation coefficient (R) of 0.225 and weighted average of 95.8%. Similarly, the statistical analysis conducted on geographies consisting of 484,814,005 people shows a poor positive correlation between the proportion of Czechs and percentage of population with at least 9th grade education in the United States with a correlation coefficient (R) of 0.161 and weighted average of 96.4%, a difference of 0.57%.
9th Grade Correlation Summary
| Measurement | Immigrants from Netherlands | Czech |
| Minimum | 91.8% | 84.8% |
| Maximum | 100.0% | 100.0% |
| Range | 8.2% | 15.2% |
| Mean | 97.6% | 96.8% |
| Median | 97.8% | 97.3% |
| Interquartile 25% (IQ1) | 96.7% | 95.5% |
| Interquartile 75% (IQ3) | 99.2% | 98.5% |
| Interquartile Range (IQR) | 2.5% | 3.0% |
| Standard Deviation (Sample) | 2.0% | 2.7% |
| Standard Deviation (Population) | 2.0% | 2.7% |
Similar Demographics by 9th Grade
Demographics Similar to Immigrants from Netherlands by 9th Grade
In terms of 9th grade, the demographic groups most similar to Immigrants from Netherlands are Cypriot (95.8%, a difference of 0.010%), Immigrants from Ireland (95.8%, a difference of 0.010%), Immigrants from Lithuania (95.8%, a difference of 0.010%), Immigrants from England (95.9%, a difference of 0.020%), and Zimbabwean (95.9%, a difference of 0.030%).
| Demographics | Rating | Rank | 9th Grade |
| New Zealanders | 99.8 /100 | #59 | Exceptional 95.9% |
| Native Hawaiians | 99.8 /100 | #60 | Exceptional 95.9% |
| Sioux | 99.8 /100 | #61 | Exceptional 95.9% |
| Ukrainians | 99.7 /100 | #62 | Exceptional 95.9% |
| Canadians | 99.7 /100 | #63 | Exceptional 95.9% |
| Zimbabweans | 99.7 /100 | #64 | Exceptional 95.9% |
| Immigrants | England | 99.6 /100 | #65 | Exceptional 95.9% |
| Immigrants | Netherlands | 99.6 /100 | #66 | Exceptional 95.8% |
| Cypriots | 99.6 /100 | #67 | Exceptional 95.8% |
| Immigrants | Ireland | 99.6 /100 | #68 | Exceptional 95.8% |
| Immigrants | Lithuania | 99.6 /100 | #69 | Exceptional 95.8% |
| Immigrants | Australia | 99.5 /100 | #70 | Exceptional 95.8% |
| Immigrants | Belgium | 99.5 /100 | #71 | Exceptional 95.8% |
| Turks | 99.5 /100 | #72 | Exceptional 95.8% |
| Immigrants | Singapore | 99.5 /100 | #73 | Exceptional 95.8% |
Demographics Similar to Czechs by 9th Grade
In terms of 9th grade, the demographic groups most similar to Czechs are European (96.4%, a difference of 0.010%), Alaskan Athabascan (96.4%, a difference of 0.020%), Latvian (96.4%, a difference of 0.030%), Welsh (96.4%, a difference of 0.040%), and Italian (96.4%, a difference of 0.040%).
| Demographics | Rating | Rank | 9th Grade |
| Croatians | 100.0 /100 | #16 | Exceptional 96.5% |
| Dutch | 100.0 /100 | #17 | Exceptional 96.5% |
| Scandinavians | 100.0 /100 | #18 | Exceptional 96.5% |
| Welsh | 100.0 /100 | #19 | Exceptional 96.4% |
| Italians | 100.0 /100 | #20 | Exceptional 96.4% |
| Alaskan Athabascans | 100.0 /100 | #21 | Exceptional 96.4% |
| Europeans | 100.0 /100 | #22 | Exceptional 96.4% |
| Czechs | 100.0 /100 | #23 | Exceptional 96.4% |
| Latvians | 100.0 /100 | #24 | Exceptional 96.4% |
| French | 100.0 /100 | #25 | Exceptional 96.3% |
| French Canadians | 100.0 /100 | #26 | Exceptional 96.3% |
| Scotch-Irish | 100.0 /100 | #27 | Exceptional 96.3% |
| Eastern Europeans | 100.0 /100 | #28 | Exceptional 96.3% |
| Chinese | 100.0 /100 | #29 | Exceptional 96.3% |
| Maltese | 100.0 /100 | #30 | Exceptional 96.3% |