Eastern European vs Salvadoran High School Diploma
COMPARE
Eastern European
Salvadoran
High School Diploma
High School Diploma Comparison
Eastern Europeans
Salvadorans
91.9%
HIGH SCHOOL DIPLOMA
100.0/ 100
METRIC RATING
11th/ 347
METRIC RANK
81.7%
HIGH SCHOOL DIPLOMA
0.0/ 100
METRIC RATING
338th/ 347
METRIC RANK
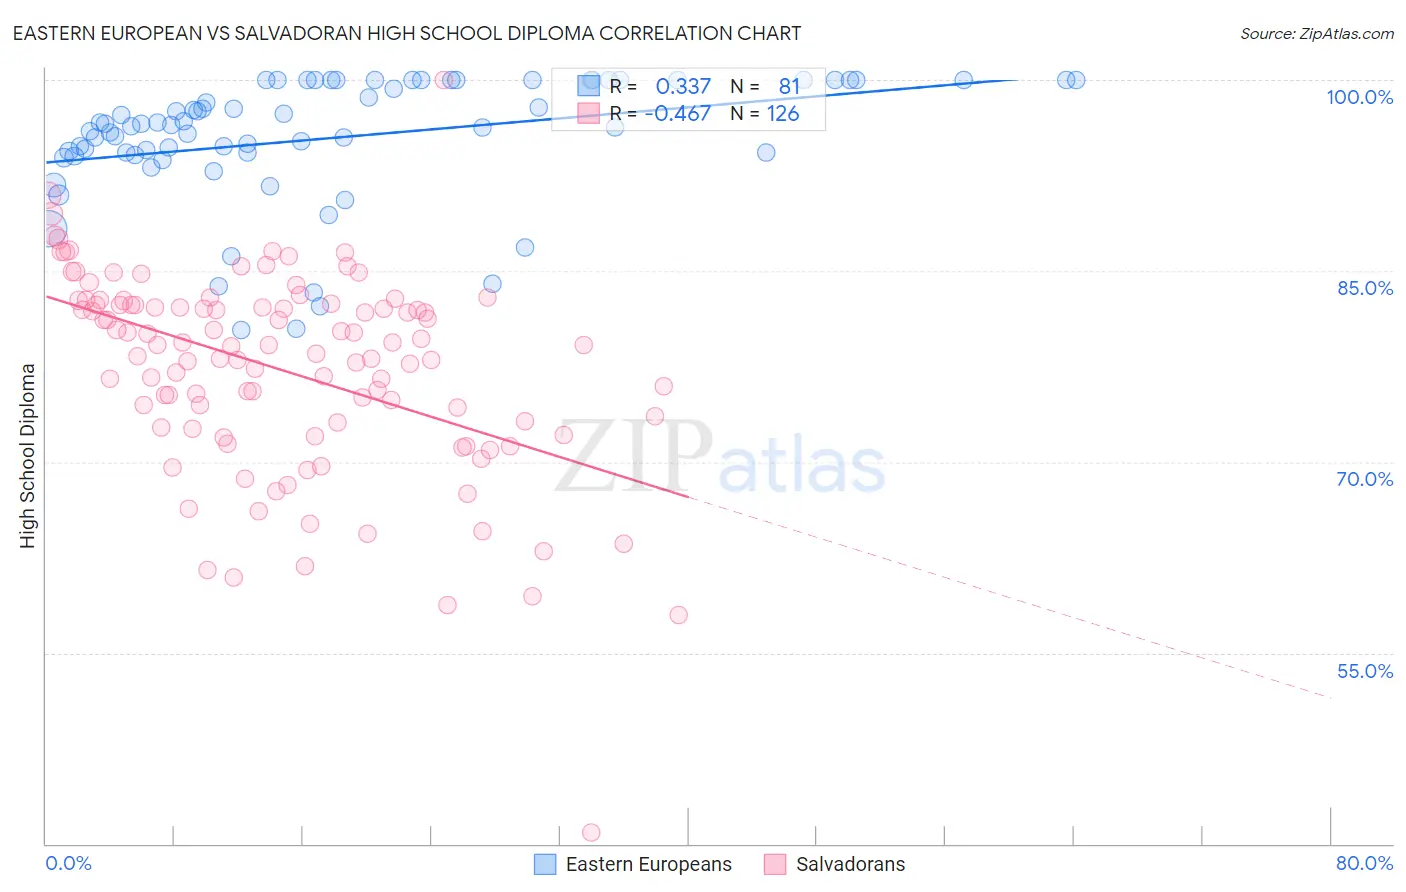
Eastern European vs Salvadoran High School Diploma Correlation Chart
The statistical analysis conducted on geographies consisting of 461,247,615 people shows a mild positive correlation between the proportion of Eastern Europeans and percentage of population with at least high school diploma education in the United States with a correlation coefficient (R) of 0.337 and weighted average of 91.9%. Similarly, the statistical analysis conducted on geographies consisting of 399,034,198 people shows a moderate negative correlation between the proportion of Salvadorans and percentage of population with at least high school diploma education in the United States with a correlation coefficient (R) of -0.467 and weighted average of 81.7%, a difference of 12.5%.
High School Diploma Correlation Summary
| Measurement | Eastern European | Salvadoran |
| Minimum | 80.3% | 40.9% |
| Maximum | 100.0% | 100.0% |
| Range | 19.7% | 59.1% |
| Mean | 95.5% | 77.2% |
| Median | 96.5% | 79.1% |
| Interquartile 25% (IQ1) | 94.2% | 72.7% |
| Interquartile 75% (IQ3) | 100.0% | 82.3% |
| Interquartile Range (IQR) | 5.8% | 9.6% |
| Standard Deviation (Sample) | 5.0% | 8.1% |
| Standard Deviation (Population) | 4.9% | 8.1% |
Similar Demographics by High School Diploma
Demographics Similar to Eastern Europeans by High School Diploma
In terms of high school diploma, the demographic groups most similar to Eastern Europeans are Polish (91.9%, a difference of 0.050%), Croatian (92.0%, a difference of 0.070%), Danish (91.8%, a difference of 0.090%), Latvian (92.0%, a difference of 0.10%), and Chinese (92.0%, a difference of 0.11%).
| Demographics | Rating | Rank | High School Diploma |
| Lithuanians | 100.0 /100 | #4 | Exceptional 92.0% |
| Slovenes | 100.0 /100 | #5 | Exceptional 92.0% |
| Slovaks | 100.0 /100 | #6 | Exceptional 92.0% |
| Immigrants | India | 100.0 /100 | #7 | Exceptional 92.0% |
| Chinese | 100.0 /100 | #8 | Exceptional 92.0% |
| Latvians | 100.0 /100 | #9 | Exceptional 92.0% |
| Croatians | 100.0 /100 | #10 | Exceptional 92.0% |
| Eastern Europeans | 100.0 /100 | #11 | Exceptional 91.9% |
| Poles | 100.0 /100 | #12 | Exceptional 91.9% |
| Danes | 100.0 /100 | #13 | Exceptional 91.8% |
| Bulgarians | 100.0 /100 | #14 | Exceptional 91.8% |
| Luxembourgers | 100.0 /100 | #15 | Exceptional 91.7% |
| Finns | 100.0 /100 | #16 | Exceptional 91.7% |
| Immigrants | Singapore | 99.9 /100 | #17 | Exceptional 91.7% |
| Germans | 99.9 /100 | #18 | Exceptional 91.7% |
Demographics Similar to Salvadorans by High School Diploma
In terms of high school diploma, the demographic groups most similar to Salvadorans are Pima (81.6%, a difference of 0.10%), Immigrants from Yemen (81.8%, a difference of 0.17%), Houma (81.5%, a difference of 0.20%), Immigrants from Dominican Republic (82.0%, a difference of 0.32%), and Guatemalan (82.0%, a difference of 0.33%).
| Demographics | Rating | Rank | High School Diploma |
| Central Americans | 0.0 /100 | #331 | Tragic 82.5% |
| Immigrants | Honduras | 0.0 /100 | #332 | Tragic 82.5% |
| Immigrants | Latin America | 0.0 /100 | #333 | Tragic 82.1% |
| Tohono O'odham | 0.0 /100 | #334 | Tragic 82.1% |
| Guatemalans | 0.0 /100 | #335 | Tragic 82.0% |
| Immigrants | Dominican Republic | 0.0 /100 | #336 | Tragic 82.0% |
| Immigrants | Yemen | 0.0 /100 | #337 | Tragic 81.8% |
| Salvadorans | 0.0 /100 | #338 | Tragic 81.7% |
| Pima | 0.0 /100 | #339 | Tragic 81.6% |
| Houma | 0.0 /100 | #340 | Tragic 81.5% |
| Mexicans | 0.0 /100 | #341 | Tragic 81.4% |
| Immigrants | Guatemala | 0.0 /100 | #342 | Tragic 81.4% |
| Immigrants | El Salvador | 0.0 /100 | #343 | Tragic 80.8% |
| Immigrants | Central America | 0.0 /100 | #344 | Tragic 80.1% |
| Yakama | 0.0 /100 | #345 | Tragic 80.0% |