Latvian vs Immigrants from Jordan 5th Grade
COMPARE
Latvian
Immigrants from Jordan
5th Grade
5th Grade Comparison
Latvians
Immigrants from Jordan
98.1%
5TH GRADE
99.9/ 100
METRIC RATING
37th/ 347
METRIC RANK
97.4%
5TH GRADE
70.4/ 100
METRIC RATING
157th/ 347
METRIC RANK
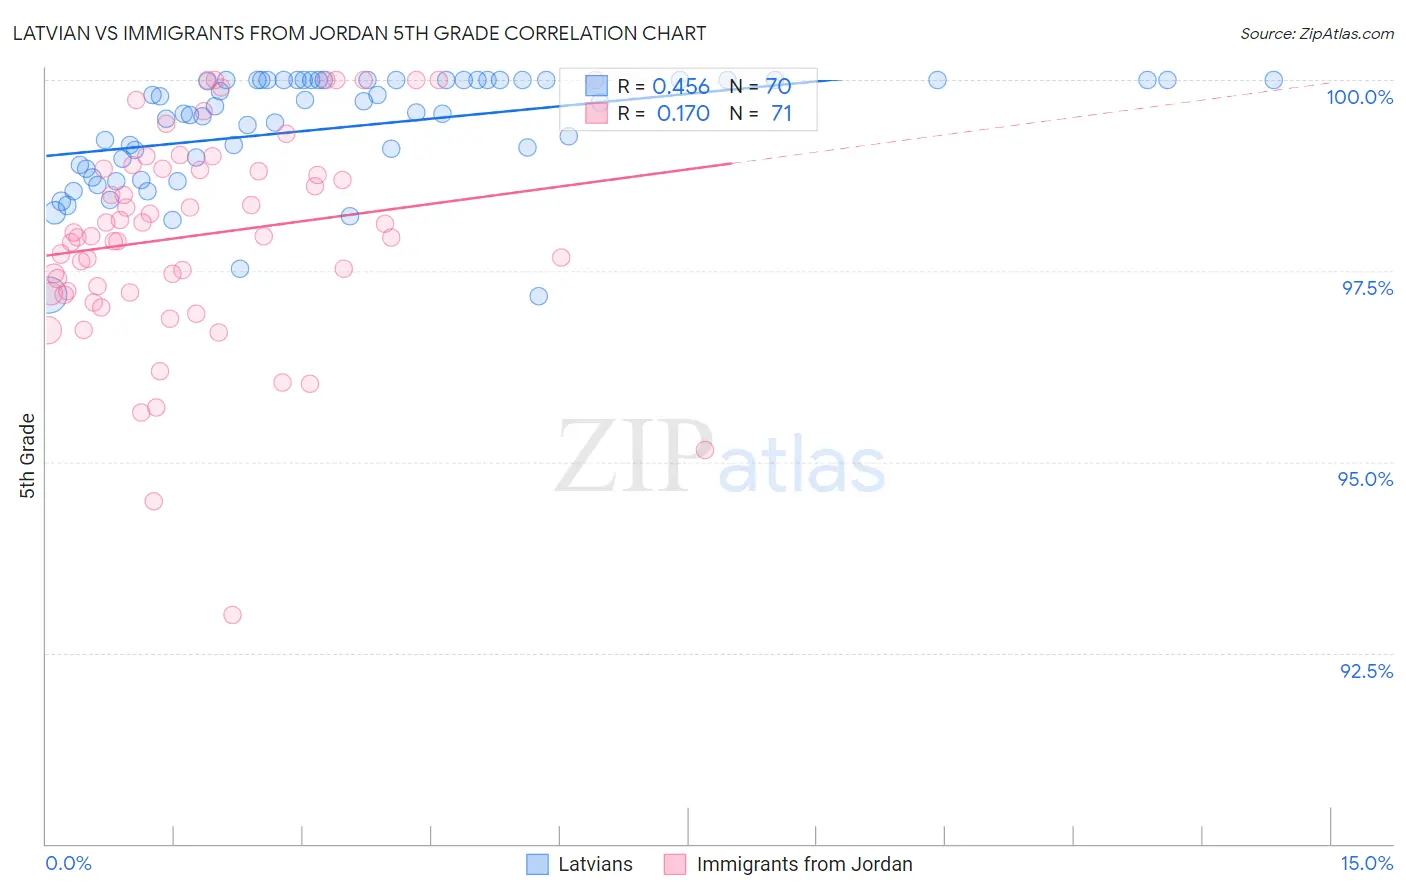
Latvian vs Immigrants from Jordan 5th Grade Correlation Chart
The statistical analysis conducted on geographies consisting of 220,726,452 people shows a moderate positive correlation between the proportion of Latvians and percentage of population with at least 5th grade education in the United States with a correlation coefficient (R) of 0.456 and weighted average of 98.1%. Similarly, the statistical analysis conducted on geographies consisting of 181,269,915 people shows a poor positive correlation between the proportion of Immigrants from Jordan and percentage of population with at least 5th grade education in the United States with a correlation coefficient (R) of 0.170 and weighted average of 97.4%, a difference of 0.68%.
5th Grade Correlation Summary
| Measurement | Latvian | Immigrants from Jordan |
| Minimum | 97.2% | 93.0% |
| Maximum | 100.0% | 100.0% |
| Range | 2.8% | 7.0% |
| Mean | 99.4% | 98.0% |
| Median | 99.6% | 98.0% |
| Interquartile 25% (IQ1) | 98.9% | 97.2% |
| Interquartile 75% (IQ3) | 100.0% | 98.8% |
| Interquartile Range (IQR) | 1.1% | 1.6% |
| Standard Deviation (Sample) | 0.73% | 1.4% |
| Standard Deviation (Population) | 0.73% | 1.4% |
Similar Demographics by 5th Grade
Demographics Similar to Latvians by 5th Grade
In terms of 5th grade, the demographic groups most similar to Latvians are Belgian (98.1%, a difference of 0.010%), Luxembourger (98.1%, a difference of 0.010%), British (98.1%, a difference of 0.020%), Eastern European (98.1%, a difference of 0.020%), and Italian (98.1%, a difference of 0.030%).
| Demographics | Rating | Rank | 5th Grade |
| French Canadians | 100.0 /100 | #30 | Exceptional 98.2% |
| Europeans | 100.0 /100 | #31 | Exceptional 98.2% |
| Chippewa | 100.0 /100 | #32 | Exceptional 98.1% |
| Swiss | 100.0 /100 | #33 | Exceptional 98.1% |
| Chinese | 100.0 /100 | #34 | Exceptional 98.1% |
| Italians | 100.0 /100 | #35 | Exceptional 98.1% |
| British | 100.0 /100 | #36 | Exceptional 98.1% |
| Latvians | 99.9 /100 | #37 | Exceptional 98.1% |
| Belgians | 99.9 /100 | #38 | Exceptional 98.1% |
| Luxembourgers | 99.9 /100 | #39 | Exceptional 98.1% |
| Eastern Europeans | 99.9 /100 | #40 | Exceptional 98.1% |
| Hungarians | 99.9 /100 | #41 | Exceptional 98.0% |
| Northern Europeans | 99.9 /100 | #42 | Exceptional 98.0% |
| Ottawa | 99.9 /100 | #43 | Exceptional 98.0% |
| Aleuts | 99.9 /100 | #44 | Exceptional 98.0% |
Demographics Similar to Immigrants from Jordan by 5th Grade
In terms of 5th grade, the demographic groups most similar to Immigrants from Jordan are Immigrants from Russia (97.4%, a difference of 0.0%), Immigrants from Bosnia and Herzegovina (97.4%, a difference of 0.0%), French American Indian (97.4%, a difference of 0.0%), Albanian (97.4%, a difference of 0.010%), and Immigrants from Eastern Europe (97.4%, a difference of 0.020%).
| Demographics | Rating | Rank | 5th Grade |
| Immigrants | South Central Asia | 78.6 /100 | #150 | Good 97.5% |
| Immigrants | Eastern Europe | 75.0 /100 | #151 | Good 97.4% |
| Ute | 74.9 /100 | #152 | Good 97.4% |
| Alsatians | 74.3 /100 | #153 | Good 97.4% |
| Immigrants | Russia | 71.2 /100 | #154 | Good 97.4% |
| Immigrants | Bosnia and Herzegovina | 71.0 /100 | #155 | Good 97.4% |
| French American Indians | 70.5 /100 | #156 | Good 97.4% |
| Immigrants | Jordan | 70.4 /100 | #157 | Good 97.4% |
| Albanians | 68.3 /100 | #158 | Good 97.4% |
| Immigrants | Italy | 65.2 /100 | #159 | Good 97.4% |
| Marshallese | 61.2 /100 | #160 | Good 97.4% |
| Kenyans | 59.7 /100 | #161 | Average 97.4% |
| Immigrants | Iran | 59.5 /100 | #162 | Average 97.4% |
| Ugandans | 58.9 /100 | #163 | Average 97.4% |
| Bermudans | 58.8 /100 | #164 | Average 97.4% |