Latvian vs Immigrants from Jordan 2nd Grade
COMPARE
Latvian
Immigrants from Jordan
2nd Grade
2nd Grade Comparison
Latvians
Immigrants from Jordan
98.4%
2ND GRADE
99.9/ 100
METRIC RATING
38th/ 347
METRIC RANK
97.9%
2ND GRADE
56.3/ 100
METRIC RATING
166th/ 347
METRIC RANK
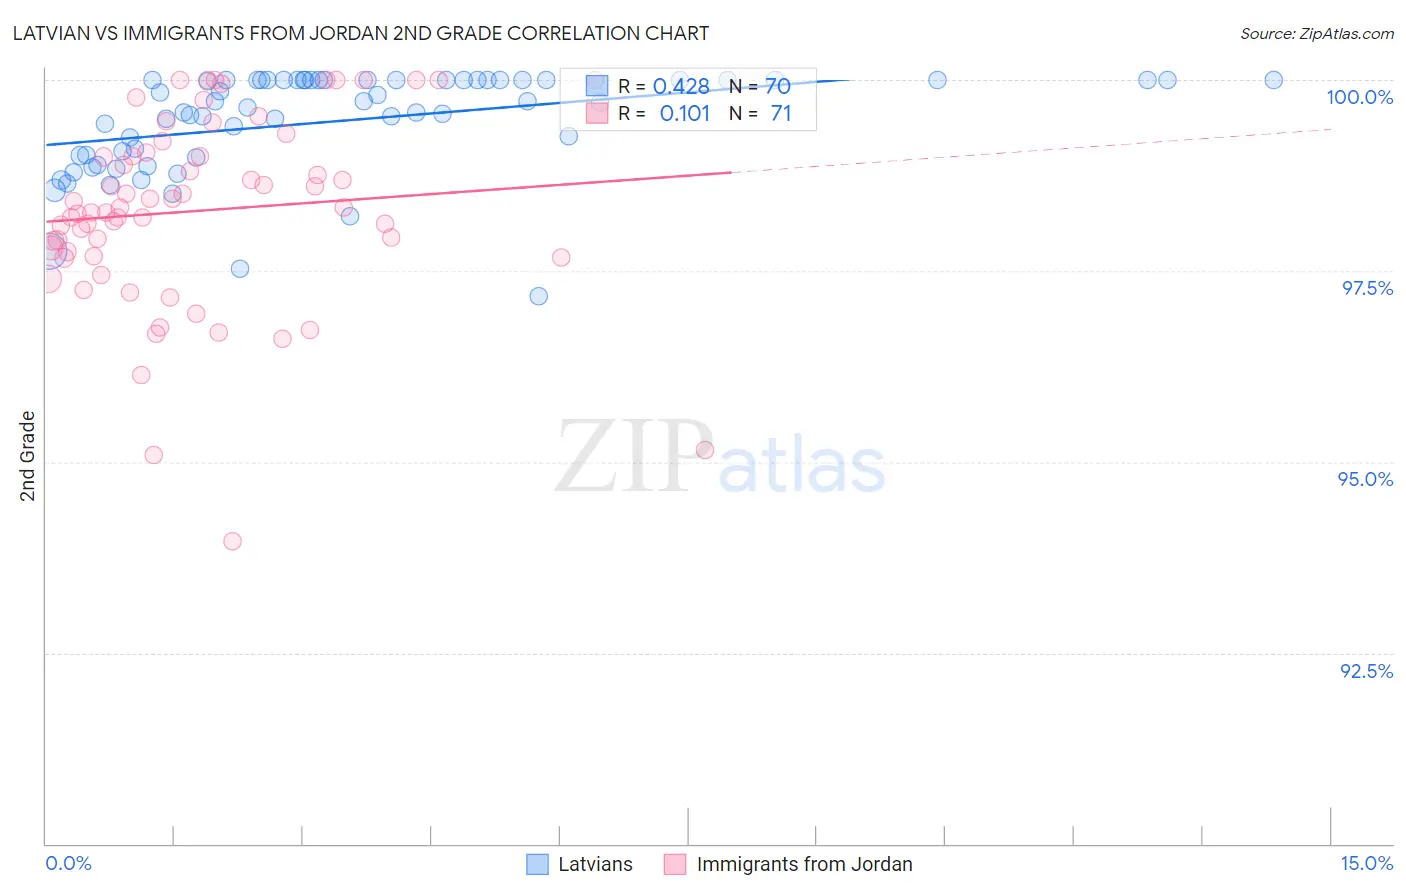
Latvian vs Immigrants from Jordan 2nd Grade Correlation Chart
The statistical analysis conducted on geographies consisting of 220,726,452 people shows a moderate positive correlation between the proportion of Latvians and percentage of population with at least 2nd grade education in the United States with a correlation coefficient (R) of 0.428 and weighted average of 98.4%. Similarly, the statistical analysis conducted on geographies consisting of 181,269,915 people shows a poor positive correlation between the proportion of Immigrants from Jordan and percentage of population with at least 2nd grade education in the United States with a correlation coefficient (R) of 0.101 and weighted average of 97.9%, a difference of 0.56%.
2nd Grade Correlation Summary
| Measurement | Latvian | Immigrants from Jordan |
| Minimum | 97.2% | 94.0% |
| Maximum | 100.0% | 100.0% |
| Range | 2.8% | 6.0% |
| Mean | 99.5% | 98.3% |
| Median | 99.7% | 98.3% |
| Interquartile 25% (IQ1) | 99.0% | 97.7% |
| Interquartile 75% (IQ3) | 100.0% | 99.1% |
| Interquartile Range (IQR) | 0.99% | 1.4% |
| Standard Deviation (Sample) | 0.66% | 1.2% |
| Standard Deviation (Population) | 0.66% | 1.2% |
Similar Demographics by 2nd Grade
Demographics Similar to Latvians by 2nd Grade
In terms of 2nd grade, the demographic groups most similar to Latvians are Chippewa (98.4%, a difference of 0.0%), Italian (98.4%, a difference of 0.010%), Luxembourger (98.4%, a difference of 0.010%), Eastern European (98.4%, a difference of 0.010%), and Native Hawaiian (98.4%, a difference of 0.020%).
| Demographics | Rating | Rank | 2nd Grade |
| Czechs | 100.0 /100 | #31 | Exceptional 98.5% |
| French Canadians | 100.0 /100 | #32 | Exceptional 98.5% |
| Scandinavians | 100.0 /100 | #33 | Exceptional 98.5% |
| Chinese | 100.0 /100 | #34 | Exceptional 98.5% |
| Swiss | 100.0 /100 | #35 | Exceptional 98.5% |
| British | 100.0 /100 | #36 | Exceptional 98.5% |
| Italians | 99.9 /100 | #37 | Exceptional 98.4% |
| Latvians | 99.9 /100 | #38 | Exceptional 98.4% |
| Chippewa | 99.9 /100 | #39 | Exceptional 98.4% |
| Luxembourgers | 99.9 /100 | #40 | Exceptional 98.4% |
| Eastern Europeans | 99.9 /100 | #41 | Exceptional 98.4% |
| Native Hawaiians | 99.9 /100 | #42 | Exceptional 98.4% |
| Belgians | 99.9 /100 | #43 | Exceptional 98.4% |
| Northern Europeans | 99.9 /100 | #44 | Exceptional 98.4% |
| Hungarians | 99.9 /100 | #45 | Exceptional 98.4% |
Demographics Similar to Immigrants from Jordan by 2nd Grade
In terms of 2nd grade, the demographic groups most similar to Immigrants from Jordan are Ugandan (97.9%, a difference of 0.0%), Spanish American (97.9%, a difference of 0.0%), Chilean (97.9%, a difference of 0.0%), Brazilian (97.9%, a difference of 0.0%), and Immigrants from Spain (97.9%, a difference of 0.0%).
| Demographics | Rating | Rank | 2nd Grade |
| Comanche | 62.8 /100 | #159 | Good 97.9% |
| Immigrants | Eastern Europe | 61.1 /100 | #160 | Good 97.9% |
| Immigrants | Russia | 60.3 /100 | #161 | Good 97.9% |
| Immigrants | Italy | 60.2 /100 | #162 | Good 97.9% |
| Bermudans | 59.4 /100 | #163 | Average 97.9% |
| Ugandans | 56.6 /100 | #164 | Average 97.9% |
| Spanish Americans | 56.4 /100 | #165 | Average 97.9% |
| Immigrants | Jordan | 56.3 /100 | #166 | Average 97.9% |
| Chileans | 56.1 /100 | #167 | Average 97.9% |
| Brazilians | 55.8 /100 | #168 | Average 97.9% |
| Immigrants | Spain | 55.4 /100 | #169 | Average 97.9% |
| Navajo | 54.3 /100 | #170 | Average 97.9% |
| Albanians | 52.8 /100 | #171 | Average 97.9% |
| Immigrants | Korea | 52.7 /100 | #172 | Average 97.9% |
| Kenyans | 52.7 /100 | #173 | Average 97.9% |