Laotian vs Immigrants from Brazil High School Diploma
COMPARE
Laotian
Immigrants from Brazil
High School Diploma
High School Diploma Comparison
Laotians
Immigrants from Brazil
89.3%
HIGH SCHOOL DIPLOMA
61.8/ 100
METRIC RATING
160th/ 347
METRIC RANK
89.5%
HIGH SCHOOL DIPLOMA
76.6/ 100
METRIC RATING
145th/ 347
METRIC RANK
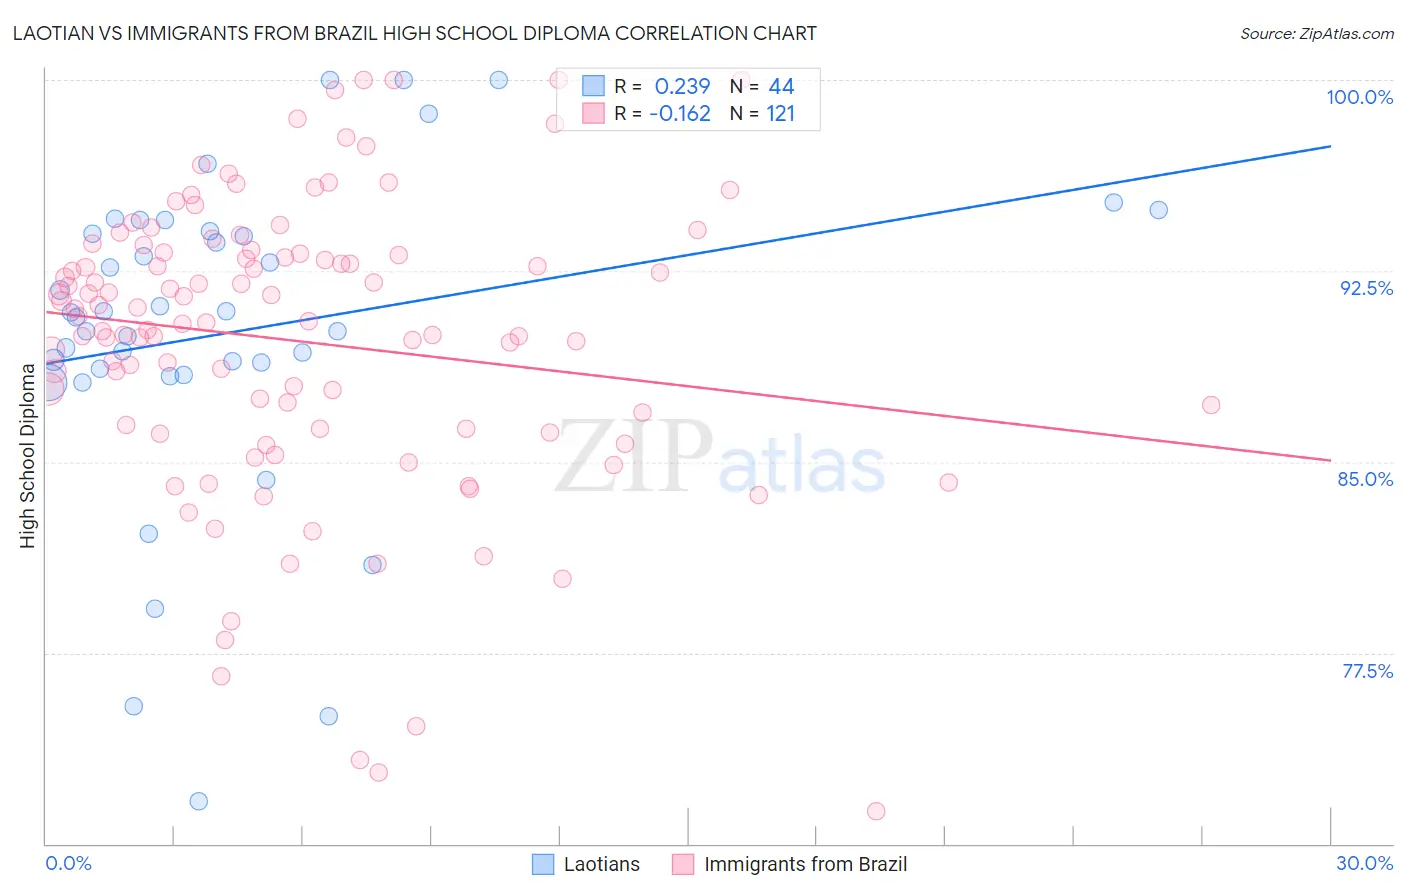
Laotian vs Immigrants from Brazil High School Diploma Correlation Chart
The statistical analysis conducted on geographies consisting of 224,854,130 people shows a weak positive correlation between the proportion of Laotians and percentage of population with at least high school diploma education in the United States with a correlation coefficient (R) of 0.239 and weighted average of 89.3%. Similarly, the statistical analysis conducted on geographies consisting of 343,021,697 people shows a poor negative correlation between the proportion of Immigrants from Brazil and percentage of population with at least high school diploma education in the United States with a correlation coefficient (R) of -0.162 and weighted average of 89.5%, a difference of 0.27%.
High School Diploma Correlation Summary
| Measurement | Laotian | Immigrants from Brazil |
| Minimum | 71.7% | 71.3% |
| Maximum | 100.0% | 100.0% |
| Range | 28.3% | 28.7% |
| Mean | 90.1% | 89.7% |
| Median | 90.8% | 90.5% |
| Interquartile 25% (IQ1) | 88.6% | 86.3% |
| Interquartile 75% (IQ3) | 94.0% | 93.2% |
| Interquartile Range (IQR) | 5.5% | 6.9% |
| Standard Deviation (Sample) | 6.3% | 5.8% |
| Standard Deviation (Population) | 6.2% | 5.8% |
Demographics Similar to Laotians and Immigrants from Brazil by High School Diploma
In terms of high school diploma, the demographic groups most similar to Laotians are Immigrants from China (89.3%, a difference of 0.0%), Immigrants from Pakistan (89.3%, a difference of 0.010%), Brazilian (89.3%, a difference of 0.010%), Bermudan (89.3%, a difference of 0.010%), and Immigrants from Malaysia (89.3%, a difference of 0.030%). Similarly, the demographic groups most similar to Immigrants from Brazil are Immigrants from Spain (89.5%, a difference of 0.010%), Immigrants from Kenya (89.6%, a difference of 0.030%), Pakistani (89.6%, a difference of 0.040%), Indian (Asian) (89.6%, a difference of 0.050%), and Iraqi (89.5%, a difference of 0.050%).
| Demographics | Rating | Rank | High School Diploma |
| Indians (Asian) | 78.8 /100 | #142 | Good 89.6% |
| Pakistanis | 78.3 /100 | #143 | Good 89.6% |
| Immigrants | Kenya | 78.0 /100 | #144 | Good 89.6% |
| Immigrants | Brazil | 76.6 /100 | #145 | Good 89.5% |
| Immigrants | Spain | 76.2 /100 | #146 | Good 89.5% |
| Iraqis | 73.9 /100 | #147 | Good 89.5% |
| Immigrants | Lebanon | 73.4 /100 | #148 | Good 89.5% |
| Immigrants | Poland | 72.9 /100 | #149 | Good 89.5% |
| Argentineans | 72.3 /100 | #150 | Good 89.5% |
| Paraguayans | 71.4 /100 | #151 | Good 89.5% |
| Asians | 70.7 /100 | #152 | Good 89.4% |
| Immigrants | Iraq | 68.7 /100 | #153 | Good 89.4% |
| Alsatians | 66.8 /100 | #154 | Good 89.4% |
| Immigrants | Northern Africa | 66.4 /100 | #155 | Good 89.4% |
| Immigrants | Argentina | 65.5 /100 | #156 | Good 89.4% |
| Immigrants | Malaysia | 63.5 /100 | #157 | Good 89.3% |
| Immigrants | Pakistan | 62.5 /100 | #158 | Good 89.3% |
| Immigrants | China | 62.0 /100 | #159 | Good 89.3% |
| Laotians | 61.8 /100 | #160 | Good 89.3% |
| Brazilians | 61.2 /100 | #161 | Good 89.3% |
| Bermudans | 61.1 /100 | #162 | Good 89.3% |