Laotian vs Finnish High School Diploma
COMPARE
Laotian
Finnish
High School Diploma
High School Diploma Comparison
Laotians
Finns
89.3%
HIGH SCHOOL DIPLOMA
61.8/ 100
METRIC RATING
160th/ 347
METRIC RANK
91.7%
HIGH SCHOOL DIPLOMA
100.0/ 100
METRIC RATING
16th/ 347
METRIC RANK
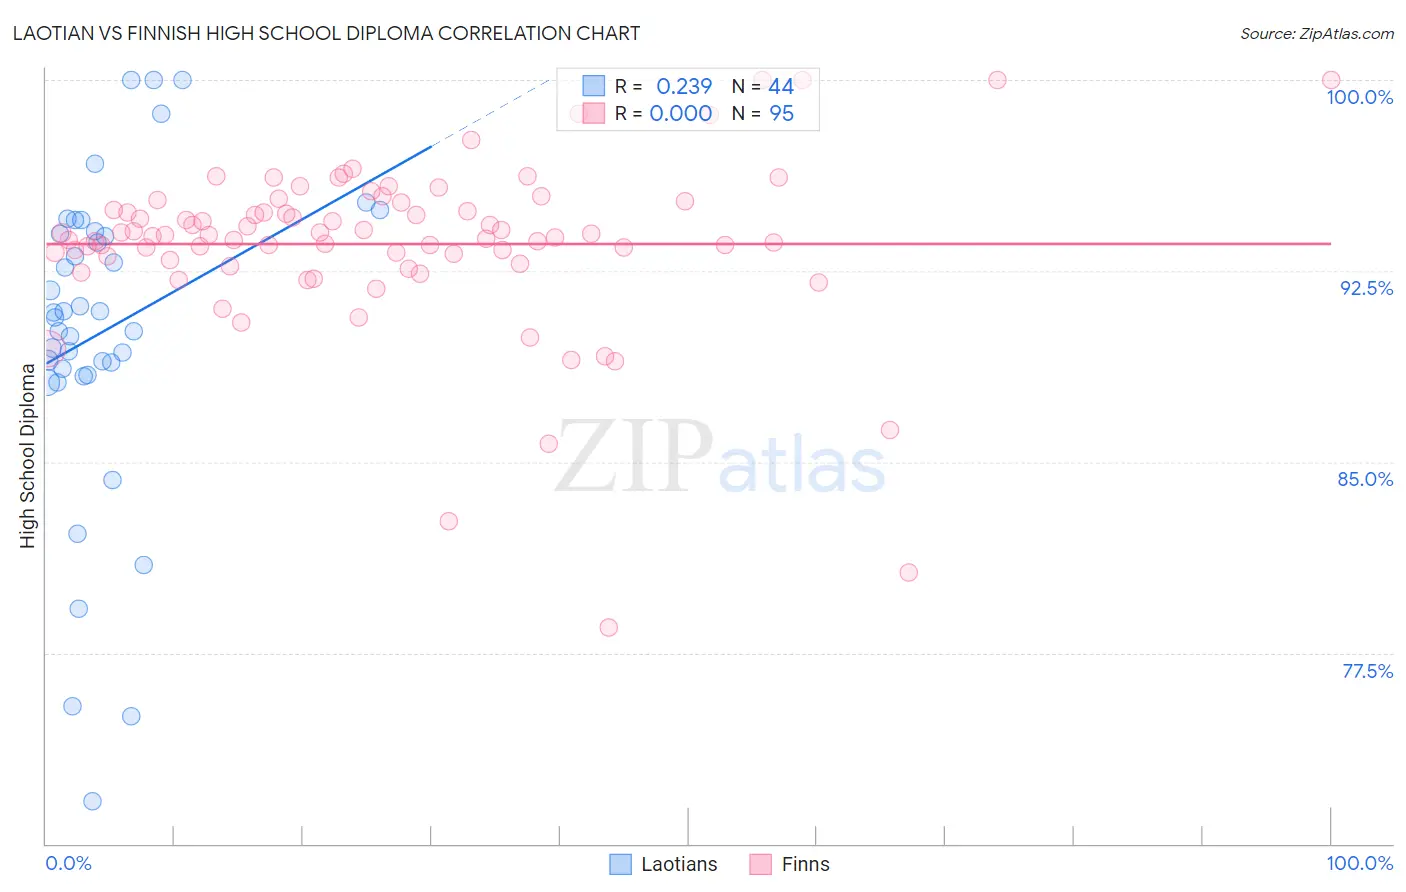
Laotian vs Finnish High School Diploma Correlation Chart
The statistical analysis conducted on geographies consisting of 224,854,130 people shows a weak positive correlation between the proportion of Laotians and percentage of population with at least high school diploma education in the United States with a correlation coefficient (R) of 0.239 and weighted average of 89.3%. Similarly, the statistical analysis conducted on geographies consisting of 404,676,167 people shows no correlation between the proportion of Finns and percentage of population with at least high school diploma education in the United States with a correlation coefficient (R) of 0.000 and weighted average of 91.7%, a difference of 2.7%.
High School Diploma Correlation Summary
| Measurement | Laotian | Finnish |
| Minimum | 71.7% | 78.5% |
| Maximum | 100.0% | 100.0% |
| Range | 28.3% | 21.5% |
| Mean | 90.1% | 93.6% |
| Median | 90.8% | 93.9% |
| Interquartile 25% (IQ1) | 88.6% | 92.9% |
| Interquartile 75% (IQ3) | 94.0% | 95.2% |
| Interquartile Range (IQR) | 5.5% | 2.3% |
| Standard Deviation (Sample) | 6.3% | 3.4% |
| Standard Deviation (Population) | 6.2% | 3.4% |
Similar Demographics by High School Diploma
Demographics Similar to Laotians by High School Diploma
In terms of high school diploma, the demographic groups most similar to Laotians are Immigrants from China (89.3%, a difference of 0.0%), Immigrants from Pakistan (89.3%, a difference of 0.010%), Brazilian (89.3%, a difference of 0.010%), Bermudan (89.3%, a difference of 0.010%), and Cree (89.3%, a difference of 0.010%).
| Demographics | Rating | Rank | High School Diploma |
| Immigrants | Iraq | 68.7 /100 | #153 | Good 89.4% |
| Alsatians | 66.8 /100 | #154 | Good 89.4% |
| Immigrants | Northern Africa | 66.4 /100 | #155 | Good 89.4% |
| Immigrants | Argentina | 65.5 /100 | #156 | Good 89.4% |
| Immigrants | Malaysia | 63.5 /100 | #157 | Good 89.3% |
| Immigrants | Pakistan | 62.5 /100 | #158 | Good 89.3% |
| Immigrants | China | 62.0 /100 | #159 | Good 89.3% |
| Laotians | 61.8 /100 | #160 | Good 89.3% |
| Brazilians | 61.2 /100 | #161 | Good 89.3% |
| Bermudans | 61.1 /100 | #162 | Good 89.3% |
| Cree | 61.1 /100 | #163 | Good 89.3% |
| Immigrants | Nepal | 61.1 /100 | #164 | Good 89.3% |
| Immigrants | Asia | 59.8 /100 | #165 | Average 89.3% |
| Immigrants | Albania | 59.4 /100 | #166 | Average 89.3% |
| Immigrants | Hong Kong | 58.6 /100 | #167 | Average 89.3% |
Demographics Similar to Finns by High School Diploma
In terms of high school diploma, the demographic groups most similar to Finns are Luxembourger (91.7%, a difference of 0.020%), Immigrants from Singapore (91.7%, a difference of 0.040%), Bulgarian (91.8%, a difference of 0.050%), German (91.7%, a difference of 0.050%), and Danish (91.8%, a difference of 0.10%).
| Demographics | Rating | Rank | High School Diploma |
| Latvians | 100.0 /100 | #9 | Exceptional 92.0% |
| Croatians | 100.0 /100 | #10 | Exceptional 92.0% |
| Eastern Europeans | 100.0 /100 | #11 | Exceptional 91.9% |
| Poles | 100.0 /100 | #12 | Exceptional 91.9% |
| Danes | 100.0 /100 | #13 | Exceptional 91.8% |
| Bulgarians | 100.0 /100 | #14 | Exceptional 91.8% |
| Luxembourgers | 100.0 /100 | #15 | Exceptional 91.7% |
| Finns | 100.0 /100 | #16 | Exceptional 91.7% |
| Immigrants | Singapore | 99.9 /100 | #17 | Exceptional 91.7% |
| Germans | 99.9 /100 | #18 | Exceptional 91.7% |
| Maltese | 99.9 /100 | #19 | Exceptional 91.6% |
| Czechs | 99.9 /100 | #20 | Exceptional 91.6% |
| Filipinos | 99.9 /100 | #21 | Exceptional 91.6% |
| Estonians | 99.9 /100 | #22 | Exceptional 91.6% |
| Scandinavians | 99.9 /100 | #23 | Exceptional 91.5% |