Immigrants from South America vs Immigrants from Kazakhstan High School Diploma
COMPARE
Immigrants from South America
Immigrants from Kazakhstan
High School Diploma
High School Diploma Comparison
Immigrants from South America
Immigrants from Kazakhstan
87.6%
HIGH SCHOOL DIPLOMA
1.2/ 100
METRIC RATING
252nd/ 347
METRIC RANK
90.0%
HIGH SCHOOL DIPLOMA
93.4/ 100
METRIC RATING
122nd/ 347
METRIC RANK
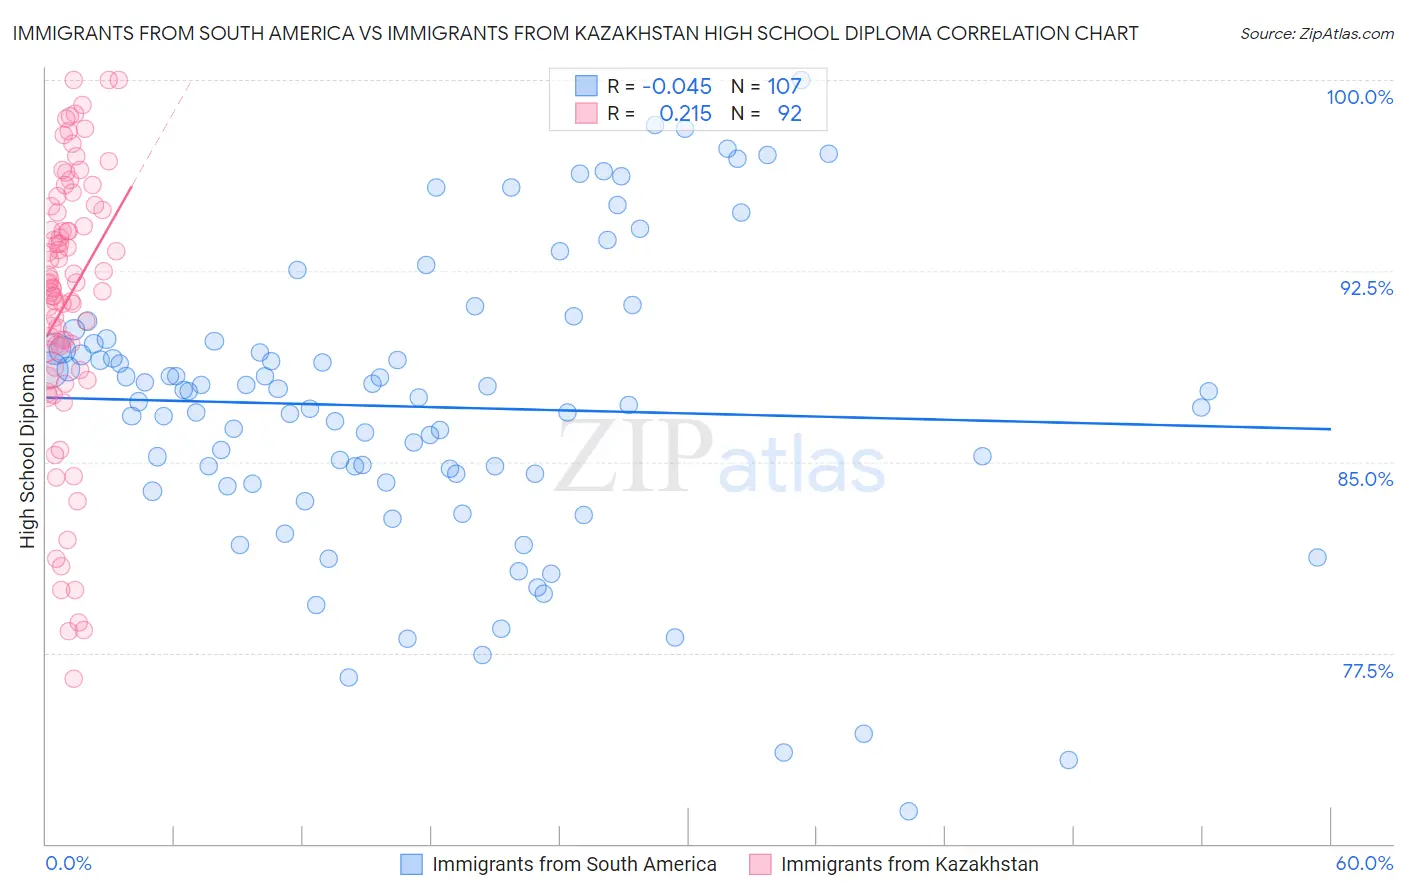
Immigrants from South America vs Immigrants from Kazakhstan High School Diploma Correlation Chart
The statistical analysis conducted on geographies consisting of 486,312,594 people shows no correlation between the proportion of Immigrants from South America and percentage of population with at least high school diploma education in the United States with a correlation coefficient (R) of -0.045 and weighted average of 87.6%. Similarly, the statistical analysis conducted on geographies consisting of 124,444,172 people shows a weak positive correlation between the proportion of Immigrants from Kazakhstan and percentage of population with at least high school diploma education in the United States with a correlation coefficient (R) of 0.215 and weighted average of 90.0%, a difference of 2.7%.
High School Diploma Correlation Summary
| Measurement | Immigrants from South America | Immigrants from Kazakhstan |
| Minimum | 71.3% | 76.5% |
| Maximum | 100.0% | 100.0% |
| Range | 28.7% | 23.5% |
| Mean | 87.2% | 91.4% |
| Median | 87.5% | 92.0% |
| Interquartile 25% (IQ1) | 84.2% | 89.0% |
| Interquartile 75% (IQ3) | 89.7% | 95.0% |
| Interquartile Range (IQR) | 5.5% | 5.9% |
| Standard Deviation (Sample) | 5.7% | 5.4% |
| Standard Deviation (Population) | 5.7% | 5.3% |
Similar Demographics by High School Diploma
Demographics Similar to Immigrants from South America by High School Diploma
In terms of high school diploma, the demographic groups most similar to Immigrants from South America are Immigrants from Uruguay (87.6%, a difference of 0.050%), Immigrants from Colombia (87.6%, a difference of 0.050%), Ghanaian (87.7%, a difference of 0.060%), Senegalese (87.7%, a difference of 0.10%), and Immigrants from Nigeria (87.7%, a difference of 0.10%).
| Demographics | Rating | Rank | High School Diploma |
| Peruvians | 1.9 /100 | #245 | Tragic 87.8% |
| Immigrants | Eritrea | 1.7 /100 | #246 | Tragic 87.8% |
| Immigrants | Costa Rica | 1.7 /100 | #247 | Tragic 87.8% |
| Spanish Americans | 1.5 /100 | #248 | Tragic 87.7% |
| Senegalese | 1.5 /100 | #249 | Tragic 87.7% |
| Immigrants | Nigeria | 1.5 /100 | #250 | Tragic 87.7% |
| Ghanaians | 1.4 /100 | #251 | Tragic 87.7% |
| Immigrants | South America | 1.2 /100 | #252 | Tragic 87.6% |
| Immigrants | Uruguay | 1.0 /100 | #253 | Tragic 87.6% |
| Immigrants | Colombia | 1.0 /100 | #254 | Tragic 87.6% |
| Immigrants | Senegal | 0.9 /100 | #255 | Tragic 87.6% |
| Africans | 0.7 /100 | #256 | Tragic 87.5% |
| Bahamians | 0.7 /100 | #257 | Tragic 87.5% |
| Immigrants | Ghana | 0.5 /100 | #258 | Tragic 87.4% |
| Immigrants | Western Africa | 0.5 /100 | #259 | Tragic 87.4% |
Demographics Similar to Immigrants from Kazakhstan by High School Diploma
In terms of high school diploma, the demographic groups most similar to Immigrants from Kazakhstan are White/Caucasian (90.1%, a difference of 0.050%), Ottawa (90.1%, a difference of 0.070%), German Russian (90.0%, a difference of 0.080%), Immigrants from Eastern Europe (90.1%, a difference of 0.10%), and Mongolian (89.9%, a difference of 0.10%).
| Demographics | Rating | Rank | High School Diploma |
| Immigrants | Hungary | 95.8 /100 | #115 | Exceptional 90.2% |
| Immigrants | Germany | 95.7 /100 | #116 | Exceptional 90.2% |
| Jordanians | 95.4 /100 | #117 | Exceptional 90.2% |
| Israelis | 95.1 /100 | #118 | Exceptional 90.1% |
| Immigrants | Eastern Europe | 94.9 /100 | #119 | Exceptional 90.1% |
| Ottawa | 94.4 /100 | #120 | Exceptional 90.1% |
| Whites/Caucasians | 94.1 /100 | #121 | Exceptional 90.1% |
| Immigrants | Kazakhstan | 93.4 /100 | #122 | Exceptional 90.0% |
| German Russians | 92.0 /100 | #123 | Exceptional 90.0% |
| Mongolians | 91.6 /100 | #124 | Exceptional 89.9% |
| Egyptians | 91.1 /100 | #125 | Exceptional 89.9% |
| Alaska Natives | 91.0 /100 | #126 | Exceptional 89.9% |
| Immigrants | Eastern Asia | 89.2 /100 | #127 | Excellent 89.9% |
| Puget Sound Salish | 89.1 /100 | #128 | Excellent 89.9% |
| Basques | 88.5 /100 | #129 | Excellent 89.8% |