Kenyan vs Hopi College, Under 1 year
COMPARE
Kenyan
Hopi
College, Under 1 year
College, Under 1 year Comparison
Kenyans
Hopi
66.5%
COLLEGE, UNDER 1 YEAR
81.7/ 100
METRIC RATING
146th/ 347
METRIC RANK
57.1%
COLLEGE, UNDER 1 YEAR
0.0/ 100
METRIC RATING
314th/ 347
METRIC RANK
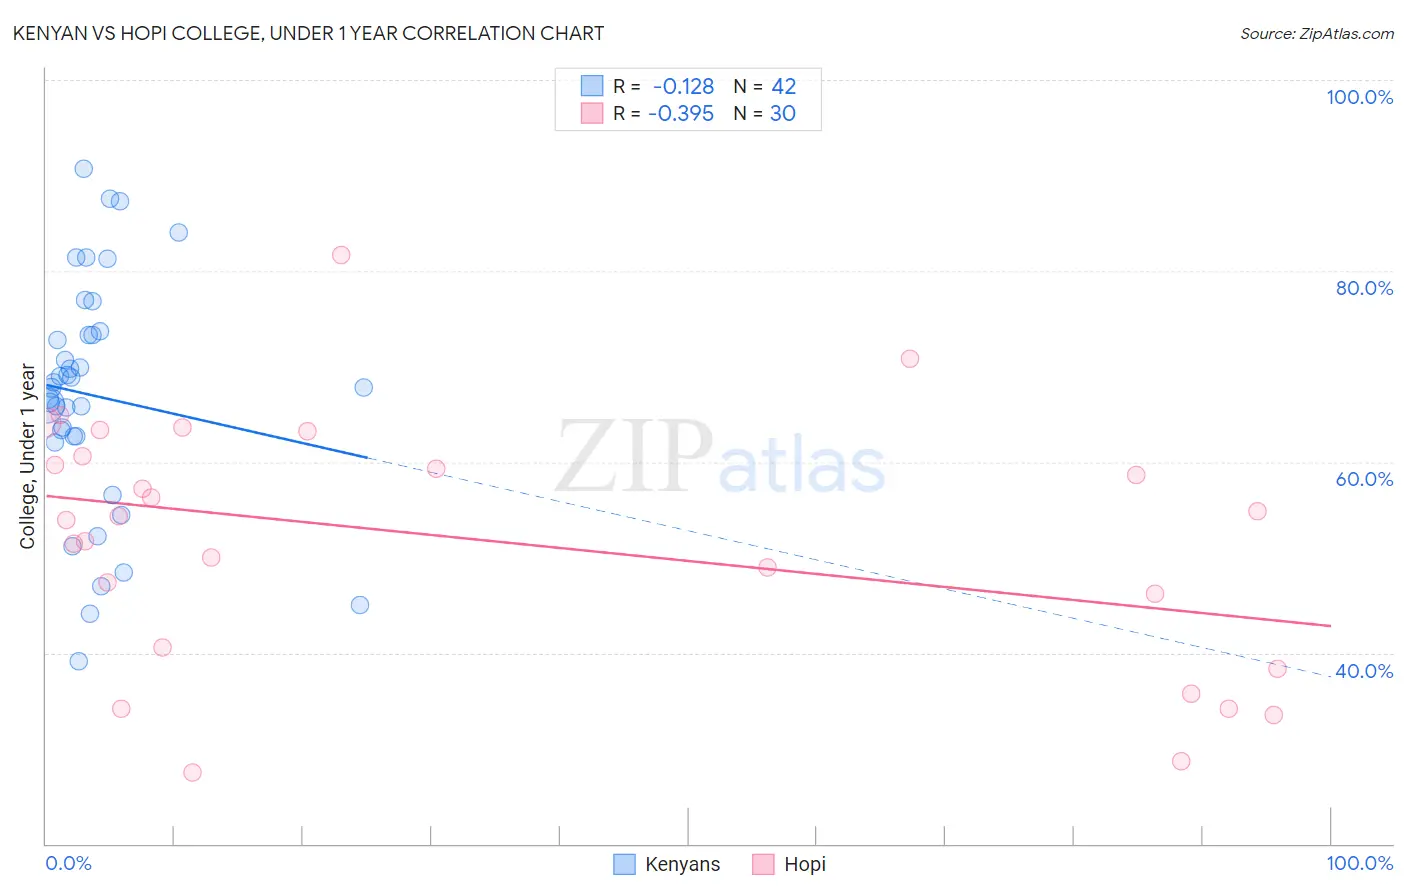
Kenyan vs Hopi College, Under 1 year Correlation Chart
The statistical analysis conducted on geographies consisting of 168,244,481 people shows a poor negative correlation between the proportion of Kenyans and percentage of population with at least college, under 1 year education in the United States with a correlation coefficient (R) of -0.128 and weighted average of 66.5%. Similarly, the statistical analysis conducted on geographies consisting of 74,740,168 people shows a mild negative correlation between the proportion of Hopi and percentage of population with at least college, under 1 year education in the United States with a correlation coefficient (R) of -0.395 and weighted average of 57.1%, a difference of 16.5%.
College, Under 1 year Correlation Summary
| Measurement | Kenyan | Hopi |
| Minimum | 39.1% | 27.5% |
| Maximum | 90.7% | 81.7% |
| Range | 51.6% | 54.2% |
| Mean | 66.9% | 51.8% |
| Median | 67.8% | 54.1% |
| Interquartile 25% (IQ1) | 62.7% | 40.5% |
| Interquartile 75% (IQ3) | 73.3% | 60.6% |
| Interquartile Range (IQR) | 10.6% | 20.0% |
| Standard Deviation (Sample) | 12.2% | 13.1% |
| Standard Deviation (Population) | 12.0% | 12.9% |
Similar Demographics by College, Under 1 year
Demographics Similar to Kenyans by College, Under 1 year
In terms of college, under 1 year, the demographic groups most similar to Kenyans are Immigrants from Kenya (66.5%, a difference of 0.0%), Immigrants from Morocco (66.5%, a difference of 0.0%), Immigrants from Germany (66.5%, a difference of 0.020%), Immigrants from Uganda (66.5%, a difference of 0.080%), and English (66.6%, a difference of 0.090%).
| Demographics | Rating | Rank | College, Under 1 year |
| Venezuelans | 85.9 /100 | #139 | Excellent 66.7% |
| Slavs | 85.9 /100 | #140 | Excellent 66.7% |
| Immigrants | Afghanistan | 85.1 /100 | #141 | Excellent 66.7% |
| English | 82.9 /100 | #142 | Excellent 66.6% |
| Immigrants | Uganda | 82.8 /100 | #143 | Excellent 66.5% |
| Immigrants | Germany | 82.0 /100 | #144 | Excellent 66.5% |
| Immigrants | Kenya | 81.8 /100 | #145 | Excellent 66.5% |
| Kenyans | 81.7 /100 | #146 | Excellent 66.5% |
| Immigrants | Morocco | 81.7 /100 | #147 | Excellent 66.5% |
| Taiwanese | 78.6 /100 | #148 | Good 66.4% |
| Immigrants | Venezuela | 77.9 /100 | #149 | Good 66.3% |
| Immigrants | Iraq | 77.1 /100 | #150 | Good 66.3% |
| Immigrants | Sudan | 76.0 /100 | #151 | Good 66.2% |
| Sudanese | 74.1 /100 | #152 | Good 66.2% |
| Belgians | 73.7 /100 | #153 | Good 66.2% |
Demographics Similar to Hopi by College, Under 1 year
In terms of college, under 1 year, the demographic groups most similar to Hopi are Honduran (57.1%, a difference of 0.040%), Menominee (57.0%, a difference of 0.10%), Dutch West Indian (57.2%, a difference of 0.12%), Hispanic or Latino (57.0%, a difference of 0.14%), and Immigrants from Haiti (56.9%, a difference of 0.25%).
| Demographics | Rating | Rank | College, Under 1 year |
| Fijians | 0.0 /100 | #307 | Tragic 57.7% |
| Central Americans | 0.0 /100 | #308 | Tragic 57.7% |
| Immigrants | Nicaragua | 0.0 /100 | #309 | Tragic 57.6% |
| Pueblo | 0.0 /100 | #310 | Tragic 57.4% |
| Cajuns | 0.0 /100 | #311 | Tragic 57.3% |
| Salvadorans | 0.0 /100 | #312 | Tragic 57.3% |
| Dutch West Indians | 0.0 /100 | #313 | Tragic 57.2% |
| Hopi | 0.0 /100 | #314 | Tragic 57.1% |
| Hondurans | 0.0 /100 | #315 | Tragic 57.1% |
| Menominee | 0.0 /100 | #316 | Tragic 57.0% |
| Hispanics or Latinos | 0.0 /100 | #317 | Tragic 57.0% |
| Immigrants | Haiti | 0.0 /100 | #318 | Tragic 56.9% |
| Puerto Ricans | 0.0 /100 | #319 | Tragic 56.8% |
| Guatemalans | 0.0 /100 | #320 | Tragic 56.8% |
| Natives/Alaskans | 0.0 /100 | #321 | Tragic 56.6% |