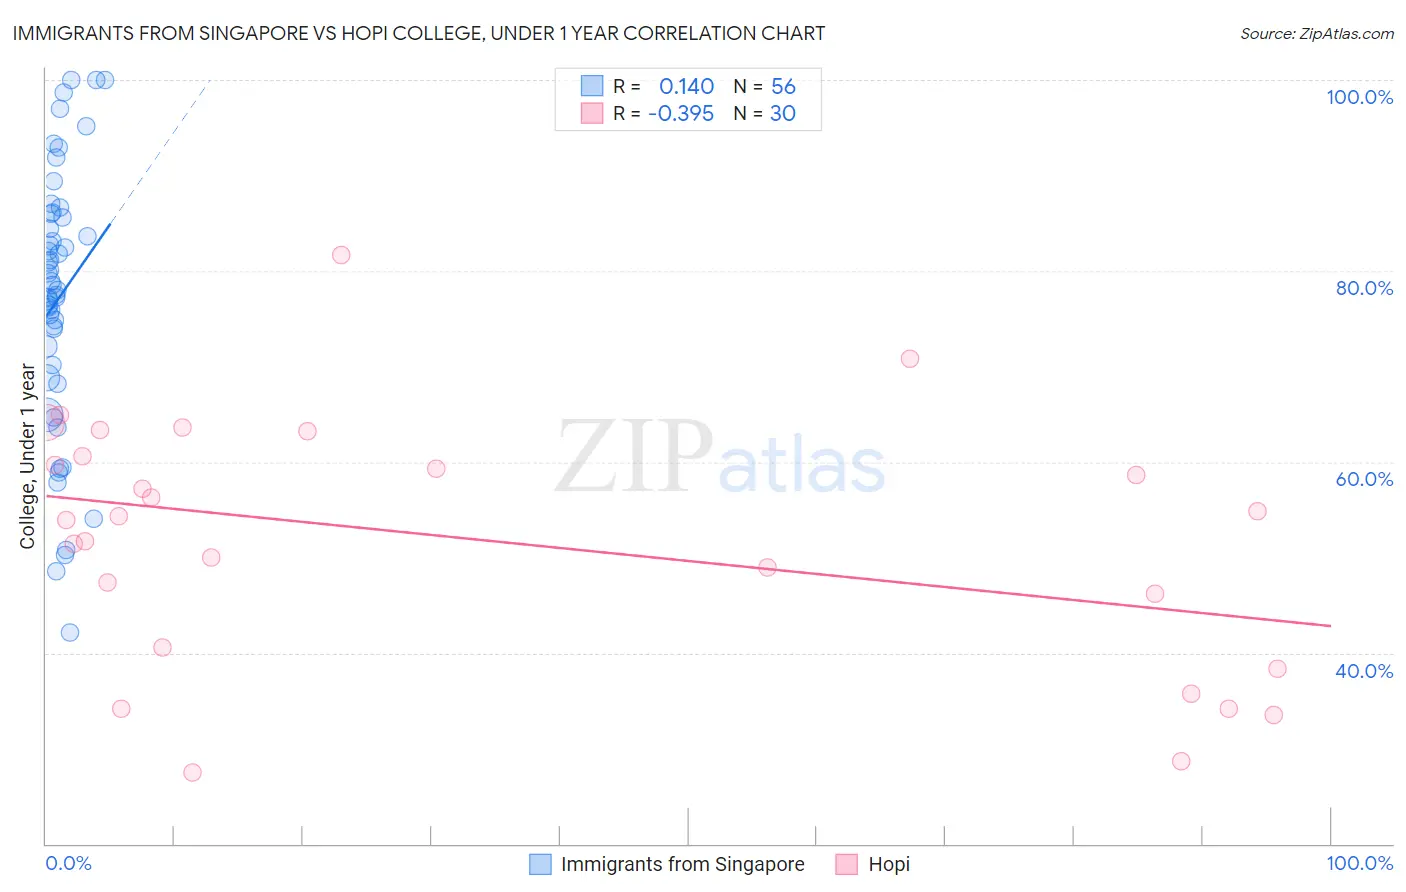
Immigrants from Singapore vs Hopi College, Under 1 year
COMPARE
Immigrants from Singapore
Hopi
College, Under 1 year
College, Under 1 year Comparison
Immigrants from Singapore
Hopi
74.8%
COLLEGE, UNDER 1 YEAR
100.0/ 100
METRIC RATING
3rd/ 347
METRIC RANK
57.1%
COLLEGE, UNDER 1 YEAR
0.0/ 100
METRIC RATING
314th/ 347
METRIC RANK
Immigrants from Singapore vs Hopi College, Under 1 year Correlation Chart
The statistical analysis conducted on geographies consisting of 137,521,094 people shows a poor positive correlation between the proportion of Immigrants from Singapore and percentage of population with at least college, under 1 year education in the United States with a correlation coefficient (R) of 0.140 and weighted average of 74.8%. Similarly, the statistical analysis conducted on geographies consisting of 74,740,168 people shows a mild negative correlation between the proportion of Hopi and percentage of population with at least college, under 1 year education in the United States with a correlation coefficient (R) of -0.395 and weighted average of 57.1%, a difference of 31.0%.
College, Under 1 year Correlation Summary
| Measurement | Immigrants from Singapore | Hopi |
| Minimum | 42.2% | 27.5% |
| Maximum | 100.0% | 81.7% |
| Range | 57.8% | 54.2% |
| Mean | 77.1% | 51.8% |
| Median | 78.3% | 54.1% |
| Interquartile 25% (IQ1) | 69.5% | 40.5% |
| Interquartile 75% (IQ3) | 85.8% | 60.6% |
| Interquartile Range (IQR) | 16.3% | 20.0% |
| Standard Deviation (Sample) | 13.8% | 13.1% |
| Standard Deviation (Population) | 13.6% | 12.9% |
Similar Demographics by College, Under 1 year
Demographics Similar to Immigrants from Singapore by College, Under 1 year
In terms of college, under 1 year, the demographic groups most similar to Immigrants from Singapore are Iranian (74.9%, a difference of 0.050%), Immigrants from India (74.4%, a difference of 0.51%), Immigrants from Iran (74.3%, a difference of 0.74%), Immigrants from Taiwan (74.2%, a difference of 0.85%), and Filipino (75.5%, a difference of 0.90%).
| Demographics | Rating | Rank | College, Under 1 year |
| Filipinos | 100.0 /100 | #1 | Exceptional 75.5% |
| Iranians | 100.0 /100 | #2 | Exceptional 74.9% |
| Immigrants | Singapore | 100.0 /100 | #3 | Exceptional 74.8% |
| Immigrants | India | 100.0 /100 | #4 | Exceptional 74.4% |
| Immigrants | Iran | 100.0 /100 | #5 | Exceptional 74.3% |
| Immigrants | Taiwan | 100.0 /100 | #6 | Exceptional 74.2% |
| Okinawans | 100.0 /100 | #7 | Exceptional 73.7% |
| Thais | 100.0 /100 | #8 | Exceptional 73.4% |
| Immigrants | Australia | 100.0 /100 | #9 | Exceptional 72.7% |
| Immigrants | Israel | 100.0 /100 | #10 | Exceptional 72.3% |
| Immigrants | South Central Asia | 100.0 /100 | #11 | Exceptional 72.1% |
| Immigrants | Sweden | 100.0 /100 | #12 | Exceptional 72.1% |
| Cypriots | 100.0 /100 | #13 | Exceptional 72.0% |
| Cambodians | 100.0 /100 | #14 | Exceptional 71.9% |
| Burmese | 100.0 /100 | #15 | Exceptional 71.9% |
Demographics Similar to Hopi by College, Under 1 year
In terms of college, under 1 year, the demographic groups most similar to Hopi are Honduran (57.1%, a difference of 0.040%), Menominee (57.0%, a difference of 0.10%), Dutch West Indian (57.2%, a difference of 0.12%), Hispanic or Latino (57.0%, a difference of 0.14%), and Immigrants from Haiti (56.9%, a difference of 0.25%).
| Demographics | Rating | Rank | College, Under 1 year |
| Fijians | 0.0 /100 | #307 | Tragic 57.7% |
| Central Americans | 0.0 /100 | #308 | Tragic 57.7% |
| Immigrants | Nicaragua | 0.0 /100 | #309 | Tragic 57.6% |
| Pueblo | 0.0 /100 | #310 | Tragic 57.4% |
| Cajuns | 0.0 /100 | #311 | Tragic 57.3% |
| Salvadorans | 0.0 /100 | #312 | Tragic 57.3% |
| Dutch West Indians | 0.0 /100 | #313 | Tragic 57.2% |
| Hopi | 0.0 /100 | #314 | Tragic 57.1% |
| Hondurans | 0.0 /100 | #315 | Tragic 57.1% |
| Menominee | 0.0 /100 | #316 | Tragic 57.0% |
| Hispanics or Latinos | 0.0 /100 | #317 | Tragic 57.0% |
| Immigrants | Haiti | 0.0 /100 | #318 | Tragic 56.9% |
| Puerto Ricans | 0.0 /100 | #319 | Tragic 56.8% |
| Guatemalans | 0.0 /100 | #320 | Tragic 56.8% |
| Natives/Alaskans | 0.0 /100 | #321 | Tragic 56.6% |