Spanish vs Hopi College, Under 1 year
COMPARE
Spanish
Hopi
College, Under 1 year
College, Under 1 year Comparison
Spanish
Hopi
64.9%
COLLEGE, UNDER 1 YEAR
31.6/ 100
METRIC RATING
189th/ 347
METRIC RANK
57.1%
COLLEGE, UNDER 1 YEAR
0.0/ 100
METRIC RATING
314th/ 347
METRIC RANK
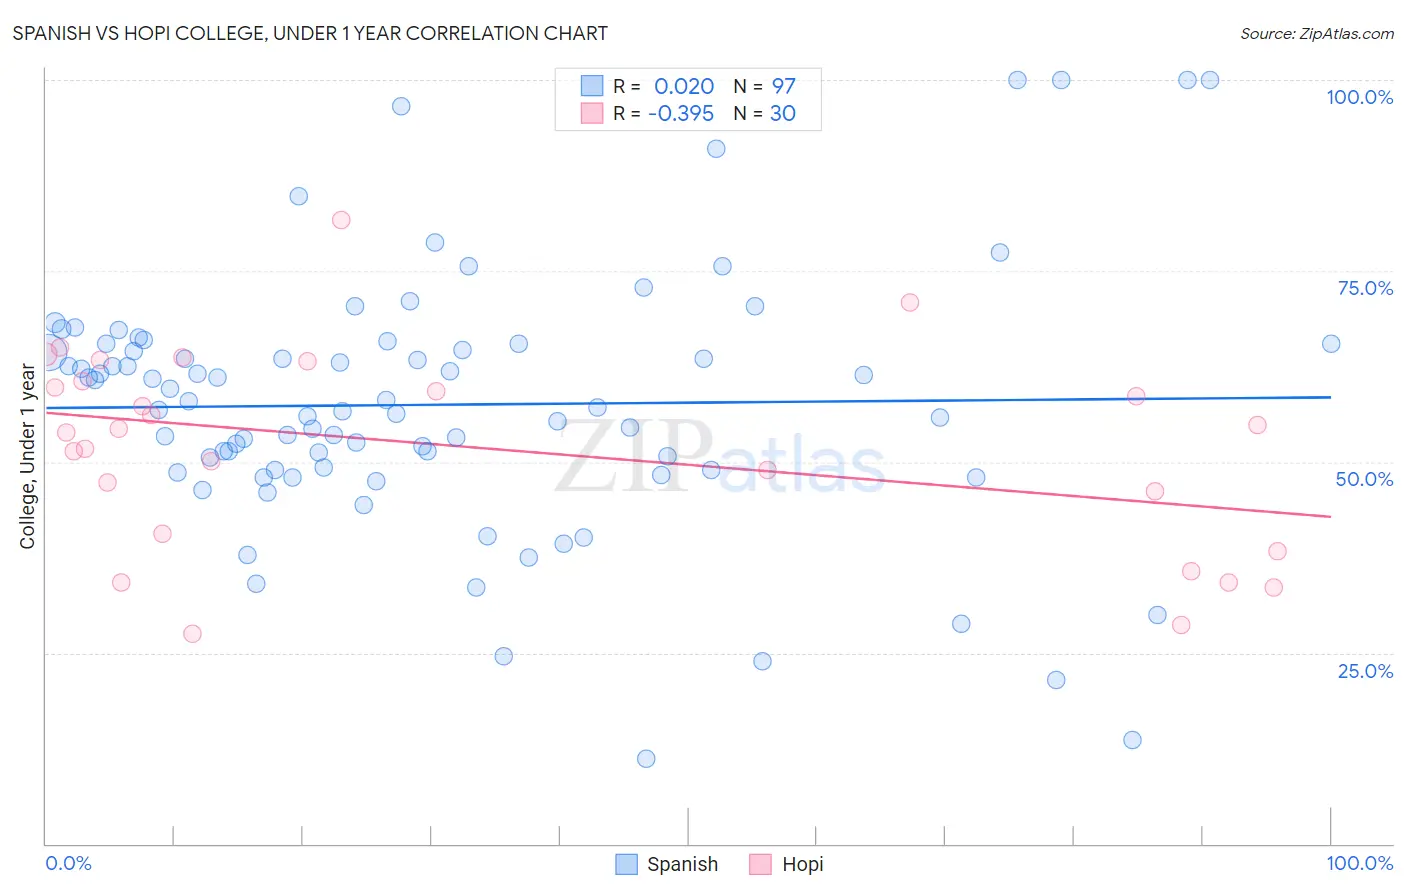
Spanish vs Hopi College, Under 1 year Correlation Chart
The statistical analysis conducted on geographies consisting of 422,188,866 people shows no correlation between the proportion of Spanish and percentage of population with at least college, under 1 year education in the United States with a correlation coefficient (R) of 0.020 and weighted average of 64.9%. Similarly, the statistical analysis conducted on geographies consisting of 74,740,168 people shows a mild negative correlation between the proportion of Hopi and percentage of population with at least college, under 1 year education in the United States with a correlation coefficient (R) of -0.395 and weighted average of 57.1%, a difference of 13.6%.
College, Under 1 year Correlation Summary
| Measurement | Spanish | Hopi |
| Minimum | 11.1% | 27.5% |
| Maximum | 100.0% | 81.7% |
| Range | 88.9% | 54.2% |
| Mean | 57.5% | 51.8% |
| Median | 57.1% | 54.1% |
| Interquartile 25% (IQ1) | 48.9% | 40.5% |
| Interquartile 75% (IQ3) | 65.5% | 60.6% |
| Interquartile Range (IQR) | 16.6% | 20.0% |
| Standard Deviation (Sample) | 17.0% | 13.1% |
| Standard Deviation (Population) | 17.0% | 12.9% |
Similar Demographics by College, Under 1 year
Demographics Similar to Spanish by College, Under 1 year
In terms of college, under 1 year, the demographic groups most similar to Spanish are Immigrants from Albania (64.9%, a difference of 0.020%), Immigrants from Philippines (64.8%, a difference of 0.080%), Immigrants from Southern Europe (64.9%, a difference of 0.14%), Immigrants from Armenia (64.7%, a difference of 0.19%), and Immigrants from Thailand (64.7%, a difference of 0.24%).
| Demographics | Rating | Rank | College, Under 1 year |
| Immigrants | Africa | 44.7 /100 | #182 | Average 65.3% |
| Immigrants | Poland | 42.6 /100 | #183 | Average 65.2% |
| Bermudans | 42.0 /100 | #184 | Average 65.2% |
| Sri Lankans | 41.7 /100 | #185 | Average 65.2% |
| Immigrants | Sierra Leone | 39.7 /100 | #186 | Fair 65.1% |
| Immigrants | Southern Europe | 34.3 /100 | #187 | Fair 64.9% |
| Immigrants | Albania | 32.0 /100 | #188 | Fair 64.9% |
| Spanish | 31.6 /100 | #189 | Fair 64.9% |
| Immigrants | Philippines | 30.1 /100 | #190 | Fair 64.8% |
| Immigrants | Armenia | 28.1 /100 | #191 | Fair 64.7% |
| Immigrants | Thailand | 27.0 /100 | #192 | Fair 64.7% |
| Slovaks | 26.7 /100 | #193 | Fair 64.7% |
| Immigrants | Cameroon | 24.6 /100 | #194 | Fair 64.6% |
| Immigrants | South Eastern Asia | 22.1 /100 | #195 | Fair 64.5% |
| Tongans | 21.2 /100 | #196 | Fair 64.5% |
Demographics Similar to Hopi by College, Under 1 year
In terms of college, under 1 year, the demographic groups most similar to Hopi are Honduran (57.1%, a difference of 0.040%), Menominee (57.0%, a difference of 0.10%), Dutch West Indian (57.2%, a difference of 0.12%), Hispanic or Latino (57.0%, a difference of 0.14%), and Immigrants from Haiti (56.9%, a difference of 0.25%).
| Demographics | Rating | Rank | College, Under 1 year |
| Fijians | 0.0 /100 | #307 | Tragic 57.7% |
| Central Americans | 0.0 /100 | #308 | Tragic 57.7% |
| Immigrants | Nicaragua | 0.0 /100 | #309 | Tragic 57.6% |
| Pueblo | 0.0 /100 | #310 | Tragic 57.4% |
| Cajuns | 0.0 /100 | #311 | Tragic 57.3% |
| Salvadorans | 0.0 /100 | #312 | Tragic 57.3% |
| Dutch West Indians | 0.0 /100 | #313 | Tragic 57.2% |
| Hopi | 0.0 /100 | #314 | Tragic 57.1% |
| Hondurans | 0.0 /100 | #315 | Tragic 57.1% |
| Menominee | 0.0 /100 | #316 | Tragic 57.0% |
| Hispanics or Latinos | 0.0 /100 | #317 | Tragic 57.0% |
| Immigrants | Haiti | 0.0 /100 | #318 | Tragic 56.9% |
| Puerto Ricans | 0.0 /100 | #319 | Tragic 56.8% |
| Guatemalans | 0.0 /100 | #320 | Tragic 56.8% |
| Natives/Alaskans | 0.0 /100 | #321 | Tragic 56.6% |