Jordanian vs Immigrants from Israel College, Under 1 year
COMPARE
Jordanian
Immigrants from Israel
College, Under 1 year
College, Under 1 year Comparison
Jordanians
Immigrants from Israel
68.0%
COLLEGE, UNDER 1 YEAR
97.4/ 100
METRIC RATING
96th/ 347
METRIC RANK
72.3%
COLLEGE, UNDER 1 YEAR
100.0/ 100
METRIC RATING
10th/ 347
METRIC RANK
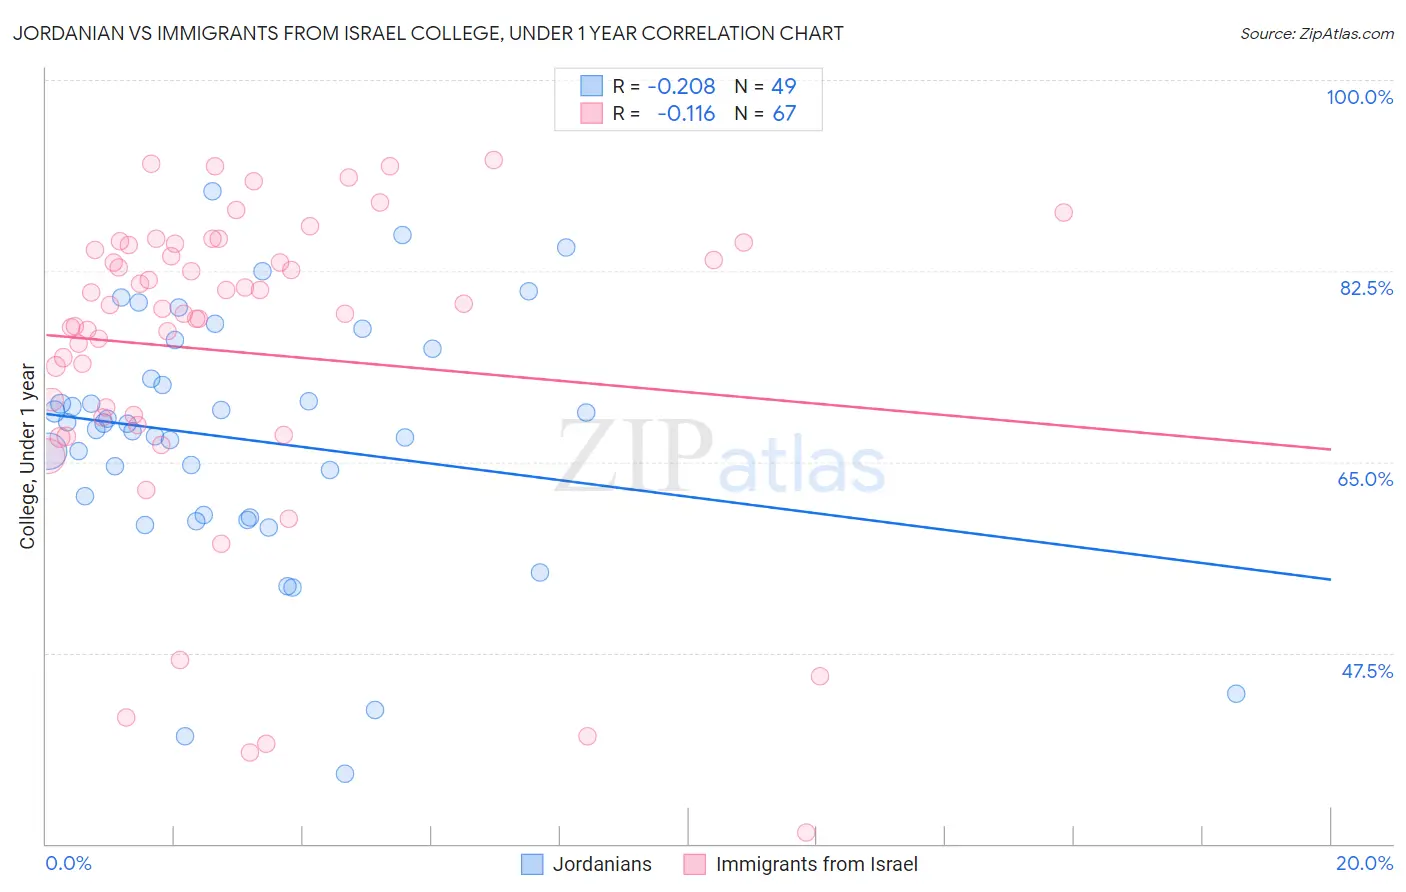
Jordanian vs Immigrants from Israel College, Under 1 year Correlation Chart
The statistical analysis conducted on geographies consisting of 166,424,117 people shows a weak negative correlation between the proportion of Jordanians and percentage of population with at least college, under 1 year education in the United States with a correlation coefficient (R) of -0.208 and weighted average of 68.0%. Similarly, the statistical analysis conducted on geographies consisting of 210,030,735 people shows a poor negative correlation between the proportion of Immigrants from Israel and percentage of population with at least college, under 1 year education in the United States with a correlation coefficient (R) of -0.116 and weighted average of 72.3%, a difference of 6.3%.
College, Under 1 year Correlation Summary
| Measurement | Jordanian | Immigrants from Israel |
| Minimum | 36.4% | 31.0% |
| Maximum | 89.8% | 92.7% |
| Range | 53.4% | 61.7% |
| Mean | 67.0% | 75.1% |
| Median | 68.5% | 79.1% |
| Interquartile 25% (IQ1) | 60.0% | 69.0% |
| Interquartile 75% (IQ3) | 74.0% | 84.9% |
| Interquartile Range (IQR) | 14.0% | 15.8% |
| Standard Deviation (Sample) | 11.5% | 14.4% |
| Standard Deviation (Population) | 11.3% | 14.3% |
Similar Demographics by College, Under 1 year
Demographics Similar to Jordanians by College, Under 1 year
In terms of college, under 1 year, the demographic groups most similar to Jordanians are Immigrants from Pakistan (68.0%, a difference of 0.030%), Immigrants from Ethiopia (68.0%, a difference of 0.030%), Armenian (68.1%, a difference of 0.13%), Paraguayan (67.9%, a difference of 0.13%), and Immigrants from Bolivia (67.9%, a difference of 0.15%).
| Demographics | Rating | Rank | College, Under 1 year |
| Ethiopians | 98.2 /100 | #89 | Exceptional 68.3% |
| Icelanders | 98.1 /100 | #90 | Exceptional 68.3% |
| Europeans | 98.1 /100 | #91 | Exceptional 68.2% |
| Luxembourgers | 98.1 /100 | #92 | Exceptional 68.2% |
| Romanians | 97.9 /100 | #93 | Exceptional 68.2% |
| Armenians | 97.7 /100 | #94 | Exceptional 68.1% |
| Immigrants | Pakistan | 97.5 /100 | #95 | Exceptional 68.0% |
| Jordanians | 97.4 /100 | #96 | Exceptional 68.0% |
| Immigrants | Ethiopia | 97.3 /100 | #97 | Exceptional 68.0% |
| Paraguayans | 97.1 /100 | #98 | Exceptional 67.9% |
| Immigrants | Bolivia | 97.0 /100 | #99 | Exceptional 67.9% |
| Immigrants | Argentina | 97.0 /100 | #100 | Exceptional 67.9% |
| Immigrants | Eastern Europe | 96.9 /100 | #101 | Exceptional 67.9% |
| Palestinians | 96.9 /100 | #102 | Exceptional 67.9% |
| Carpatho Rusyns | 96.8 /100 | #103 | Exceptional 67.9% |
Demographics Similar to Immigrants from Israel by College, Under 1 year
In terms of college, under 1 year, the demographic groups most similar to Immigrants from Israel are Immigrants from South Central Asia (72.1%, a difference of 0.30%), Immigrants from Sweden (72.1%, a difference of 0.30%), Cypriot (72.0%, a difference of 0.46%), Cambodian (71.9%, a difference of 0.58%), and Burmese (71.9%, a difference of 0.58%).
| Demographics | Rating | Rank | College, Under 1 year |
| Immigrants | Singapore | 100.0 /100 | #3 | Exceptional 74.8% |
| Immigrants | India | 100.0 /100 | #4 | Exceptional 74.4% |
| Immigrants | Iran | 100.0 /100 | #5 | Exceptional 74.3% |
| Immigrants | Taiwan | 100.0 /100 | #6 | Exceptional 74.2% |
| Okinawans | 100.0 /100 | #7 | Exceptional 73.7% |
| Thais | 100.0 /100 | #8 | Exceptional 73.4% |
| Immigrants | Australia | 100.0 /100 | #9 | Exceptional 72.7% |
| Immigrants | Israel | 100.0 /100 | #10 | Exceptional 72.3% |
| Immigrants | South Central Asia | 100.0 /100 | #11 | Exceptional 72.1% |
| Immigrants | Sweden | 100.0 /100 | #12 | Exceptional 72.1% |
| Cypriots | 100.0 /100 | #13 | Exceptional 72.0% |
| Cambodians | 100.0 /100 | #14 | Exceptional 71.9% |
| Burmese | 100.0 /100 | #15 | Exceptional 71.9% |
| Immigrants | Japan | 100.0 /100 | #16 | Exceptional 71.9% |
| Eastern Europeans | 100.0 /100 | #17 | Exceptional 71.8% |