Bermudan vs Immigrants from Israel College, Under 1 year
COMPARE
Bermudan
Immigrants from Israel
College, Under 1 year
College, Under 1 year Comparison
Bermudans
Immigrants from Israel
65.2%
COLLEGE, UNDER 1 YEAR
42.0/ 100
METRIC RATING
184th/ 347
METRIC RANK
72.3%
COLLEGE, UNDER 1 YEAR
100.0/ 100
METRIC RATING
10th/ 347
METRIC RANK
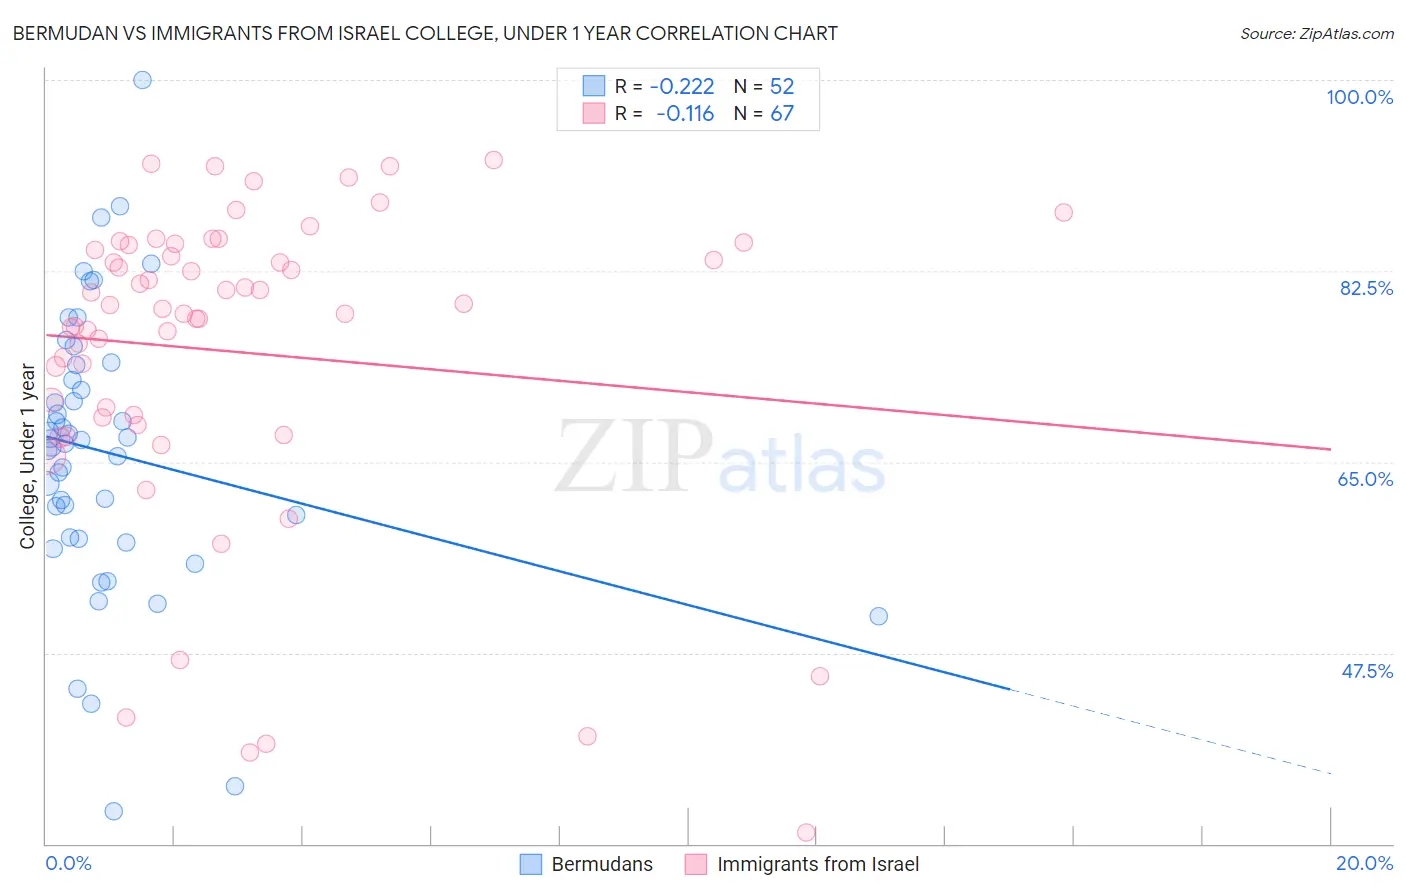
Bermudan vs Immigrants from Israel College, Under 1 year Correlation Chart
The statistical analysis conducted on geographies consisting of 55,730,379 people shows a weak negative correlation between the proportion of Bermudans and percentage of population with at least college, under 1 year education in the United States with a correlation coefficient (R) of -0.222 and weighted average of 65.2%. Similarly, the statistical analysis conducted on geographies consisting of 210,030,735 people shows a poor negative correlation between the proportion of Immigrants from Israel and percentage of population with at least college, under 1 year education in the United States with a correlation coefficient (R) of -0.116 and weighted average of 72.3%, a difference of 10.9%.
College, Under 1 year Correlation Summary
| Measurement | Bermudan | Immigrants from Israel |
| Minimum | 33.0% | 31.0% |
| Maximum | 100.0% | 92.7% |
| Range | 67.0% | 61.7% |
| Mean | 65.8% | 75.1% |
| Median | 66.8% | 79.1% |
| Interquartile 25% (IQ1) | 58.0% | 69.0% |
| Interquartile 75% (IQ3) | 73.2% | 84.9% |
| Interquartile Range (IQR) | 15.2% | 15.8% |
| Standard Deviation (Sample) | 12.9% | 14.4% |
| Standard Deviation (Population) | 12.7% | 14.3% |
Similar Demographics by College, Under 1 year
Demographics Similar to Bermudans by College, Under 1 year
In terms of college, under 1 year, the demographic groups most similar to Bermudans are Sri Lankan (65.2%, a difference of 0.010%), Immigrants from Poland (65.2%, a difference of 0.030%), Immigrants from Sierra Leone (65.1%, a difference of 0.10%), Immigrants from Africa (65.3%, a difference of 0.12%), and Spaniard (65.3%, a difference of 0.16%).
| Demographics | Rating | Rank | College, Under 1 year |
| Immigrants | North Macedonia | 48.6 /100 | #177 | Average 65.4% |
| German Russians | 48.3 /100 | #178 | Average 65.4% |
| Guamanians/Chamorros | 48.2 /100 | #179 | Average 65.4% |
| Dutch | 46.1 /100 | #180 | Average 65.3% |
| Spaniards | 45.5 /100 | #181 | Average 65.3% |
| Immigrants | Africa | 44.7 /100 | #182 | Average 65.3% |
| Immigrants | Poland | 42.6 /100 | #183 | Average 65.2% |
| Bermudans | 42.0 /100 | #184 | Average 65.2% |
| Sri Lankans | 41.7 /100 | #185 | Average 65.2% |
| Immigrants | Sierra Leone | 39.7 /100 | #186 | Fair 65.1% |
| Immigrants | Southern Europe | 34.3 /100 | #187 | Fair 64.9% |
| Immigrants | Albania | 32.0 /100 | #188 | Fair 64.9% |
| Spanish | 31.6 /100 | #189 | Fair 64.9% |
| Immigrants | Philippines | 30.1 /100 | #190 | Fair 64.8% |
| Immigrants | Armenia | 28.1 /100 | #191 | Fair 64.7% |
Demographics Similar to Immigrants from Israel by College, Under 1 year
In terms of college, under 1 year, the demographic groups most similar to Immigrants from Israel are Immigrants from South Central Asia (72.1%, a difference of 0.30%), Immigrants from Sweden (72.1%, a difference of 0.30%), Cypriot (72.0%, a difference of 0.46%), Cambodian (71.9%, a difference of 0.58%), and Burmese (71.9%, a difference of 0.58%).
| Demographics | Rating | Rank | College, Under 1 year |
| Immigrants | Singapore | 100.0 /100 | #3 | Exceptional 74.8% |
| Immigrants | India | 100.0 /100 | #4 | Exceptional 74.4% |
| Immigrants | Iran | 100.0 /100 | #5 | Exceptional 74.3% |
| Immigrants | Taiwan | 100.0 /100 | #6 | Exceptional 74.2% |
| Okinawans | 100.0 /100 | #7 | Exceptional 73.7% |
| Thais | 100.0 /100 | #8 | Exceptional 73.4% |
| Immigrants | Australia | 100.0 /100 | #9 | Exceptional 72.7% |
| Immigrants | Israel | 100.0 /100 | #10 | Exceptional 72.3% |
| Immigrants | South Central Asia | 100.0 /100 | #11 | Exceptional 72.1% |
| Immigrants | Sweden | 100.0 /100 | #12 | Exceptional 72.1% |
| Cypriots | 100.0 /100 | #13 | Exceptional 72.0% |
| Cambodians | 100.0 /100 | #14 | Exceptional 71.9% |
| Burmese | 100.0 /100 | #15 | Exceptional 71.9% |
| Immigrants | Japan | 100.0 /100 | #16 | Exceptional 71.9% |
| Eastern Europeans | 100.0 /100 | #17 | Exceptional 71.8% |