Jordanian vs Turkish 9th Grade
COMPARE
Jordanian
Turkish
9th Grade
9th Grade Comparison
Jordanians
Turks
95.3%
9TH GRADE
93.5/ 100
METRIC RATING
130th/ 347
METRIC RANK
95.8%
9TH GRADE
99.5/ 100
METRIC RATING
72nd/ 347
METRIC RANK
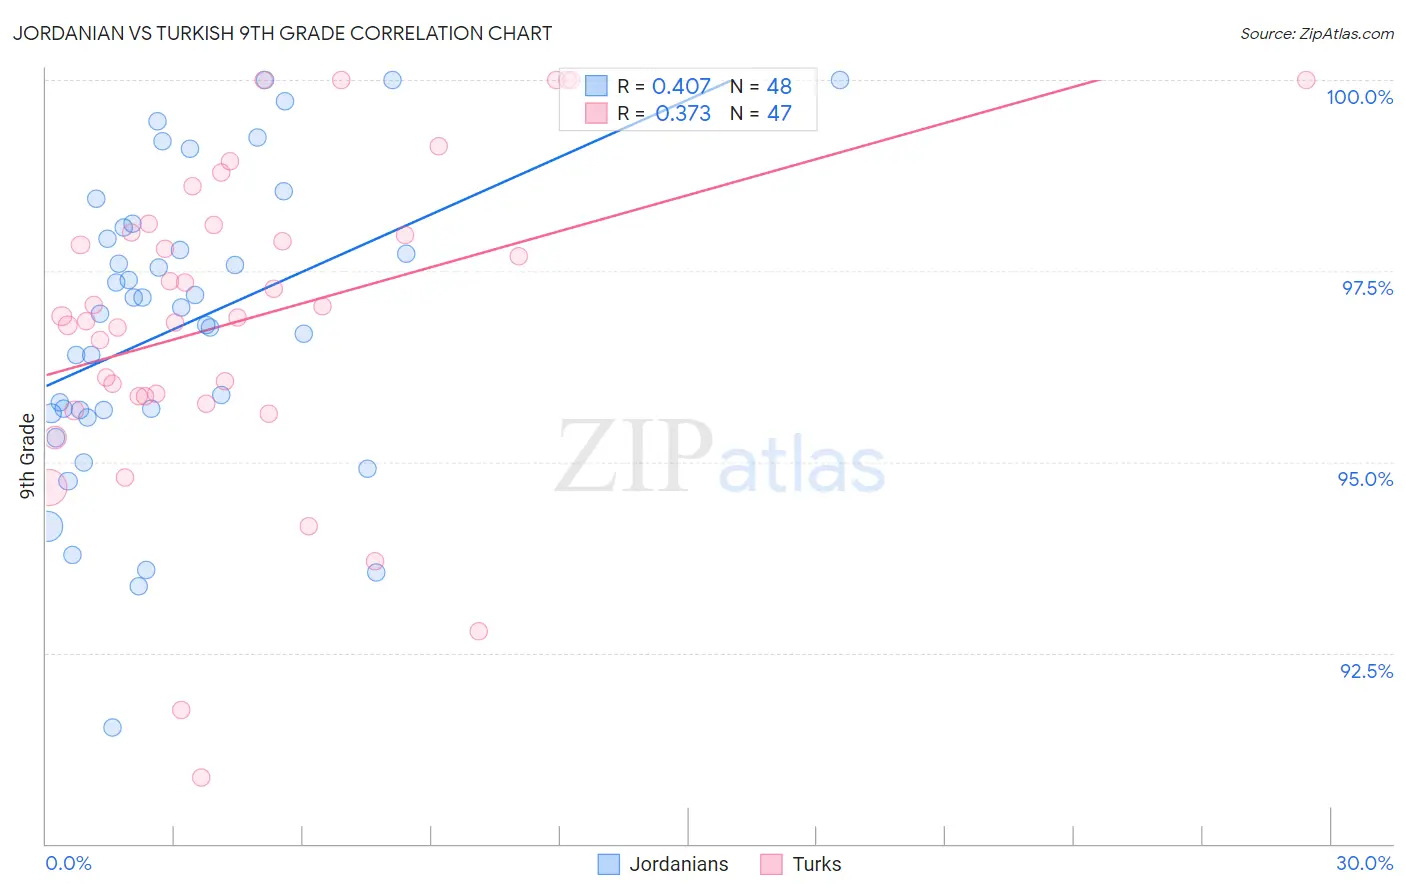
Jordanian vs Turkish 9th Grade Correlation Chart
The statistical analysis conducted on geographies consisting of 166,403,553 people shows a moderate positive correlation between the proportion of Jordanians and percentage of population with at least 9th grade education in the United States with a correlation coefficient (R) of 0.407 and weighted average of 95.3%. Similarly, the statistical analysis conducted on geographies consisting of 271,864,133 people shows a mild positive correlation between the proportion of Turks and percentage of population with at least 9th grade education in the United States with a correlation coefficient (R) of 0.373 and weighted average of 95.8%, a difference of 0.49%.
9th Grade Correlation Summary
| Measurement | Jordanian | Turkish |
| Minimum | 91.5% | 90.9% |
| Maximum | 100.0% | 100.0% |
| Range | 8.5% | 9.1% |
| Mean | 96.8% | 96.9% |
| Median | 97.0% | 96.9% |
| Interquartile 25% (IQ1) | 95.7% | 95.9% |
| Interquartile 75% (IQ3) | 98.0% | 98.1% |
| Interquartile Range (IQR) | 2.3% | 2.3% |
| Standard Deviation (Sample) | 1.9% | 2.1% |
| Standard Deviation (Population) | 1.9% | 2.1% |
Similar Demographics by 9th Grade
Demographics Similar to Jordanians by 9th Grade
In terms of 9th grade, the demographic groups most similar to Jordanians are Palestinian (95.4%, a difference of 0.020%), Immigrants from Hungary (95.4%, a difference of 0.020%), Basque (95.4%, a difference of 0.020%), Immigrants from Serbia (95.4%, a difference of 0.030%), and Immigrants from North Macedonia (95.3%, a difference of 0.030%).
| Demographics | Rating | Rank | 9th Grade |
| Kiowa | 95.3 /100 | #123 | Exceptional 95.4% |
| Shoshone | 95.3 /100 | #124 | Exceptional 95.4% |
| Immigrants | South Central Asia | 95.1 /100 | #125 | Exceptional 95.4% |
| Immigrants | Serbia | 94.4 /100 | #126 | Exceptional 95.4% |
| Palestinians | 94.3 /100 | #127 | Exceptional 95.4% |
| Immigrants | Hungary | 94.2 /100 | #128 | Exceptional 95.4% |
| Basques | 94.1 /100 | #129 | Exceptional 95.4% |
| Jordanians | 93.5 /100 | #130 | Exceptional 95.3% |
| Immigrants | North Macedonia | 92.3 /100 | #131 | Exceptional 95.3% |
| Immigrants | Nonimmigrants | 92.0 /100 | #132 | Exceptional 95.3% |
| Israelis | 90.4 /100 | #133 | Exceptional 95.3% |
| Immigrants | Israel | 89.6 /100 | #134 | Excellent 95.3% |
| Immigrants | Belarus | 88.9 /100 | #135 | Excellent 95.2% |
| Immigrants | Iran | 88.3 /100 | #136 | Excellent 95.2% |
| Hmong | 87.7 /100 | #137 | Excellent 95.2% |
Demographics Similar to Turks by 9th Grade
In terms of 9th grade, the demographic groups most similar to Turks are Immigrants from Belgium (95.8%, a difference of 0.0%), Immigrants from Singapore (95.8%, a difference of 0.0%), Immigrants from Australia (95.8%, a difference of 0.010%), Thai (95.8%, a difference of 0.010%), and Immigrants from Ireland (95.8%, a difference of 0.020%).
| Demographics | Rating | Rank | 9th Grade |
| Immigrants | England | 99.6 /100 | #65 | Exceptional 95.9% |
| Immigrants | Netherlands | 99.6 /100 | #66 | Exceptional 95.8% |
| Cypriots | 99.6 /100 | #67 | Exceptional 95.8% |
| Immigrants | Ireland | 99.6 /100 | #68 | Exceptional 95.8% |
| Immigrants | Lithuania | 99.6 /100 | #69 | Exceptional 95.8% |
| Immigrants | Australia | 99.5 /100 | #70 | Exceptional 95.8% |
| Immigrants | Belgium | 99.5 /100 | #71 | Exceptional 95.8% |
| Turks | 99.5 /100 | #72 | Exceptional 95.8% |
| Immigrants | Singapore | 99.5 /100 | #73 | Exceptional 95.8% |
| Thais | 99.5 /100 | #74 | Exceptional 95.8% |
| Inupiat | 99.5 /100 | #75 | Exceptional 95.8% |
| Immigrants | Sweden | 99.5 /100 | #76 | Exceptional 95.8% |
| Whites/Caucasians | 99.4 /100 | #77 | Exceptional 95.8% |
| Immigrants | South Africa | 99.4 /100 | #78 | Exceptional 95.8% |
| Romanians | 99.3 /100 | #79 | Exceptional 95.7% |